Get Started
Company
Copyright © 2022. Logaholic Web Analytics BV
Below you will find a short explanation of each of the Logaholic traffic reports.
Available Reports
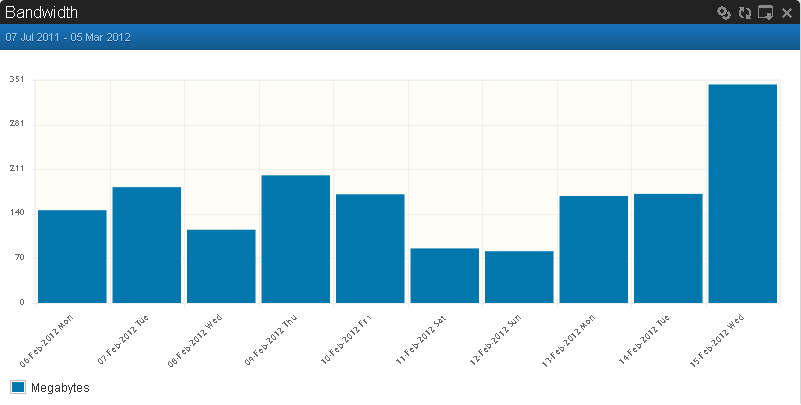
The traffic on your website consumes server capacity. The Bandwidth report ensures that you know exactly how much data has been used. Numbers are presented in Megabytes (MBs).
It’s all in the name. This reports shows how long your visitors stayed on a particular page (read: the level of engagement). The report settings lets you choose the page you want to investigate.
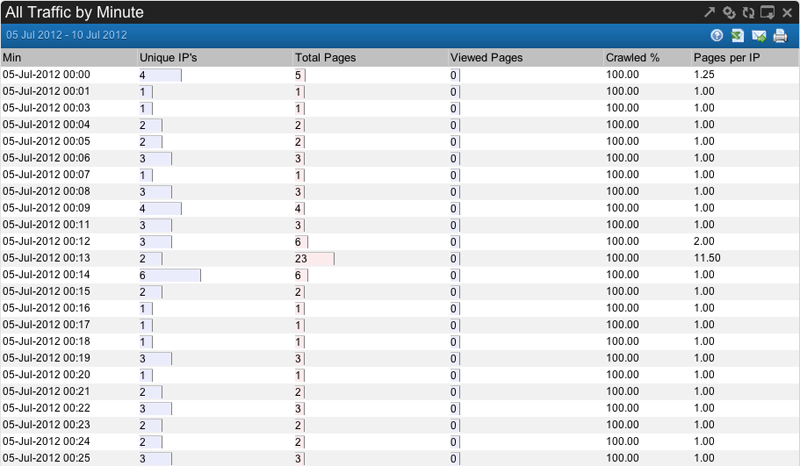
The All Traffic By Minute report shows your traffic minute by minute so you can track the peak activities in great detail.
The following information is displayed:
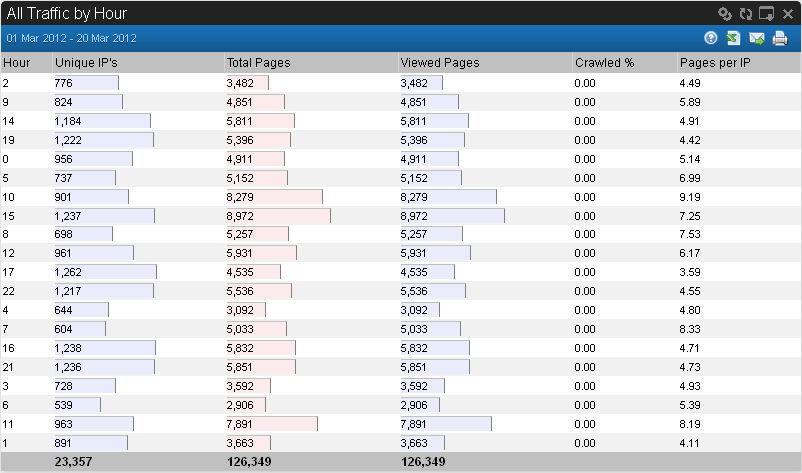
The All Traffic by Hour report shows your traffic by hour of the day(0-23) so you can track peak activities during the day (and night). The following information is displayed:
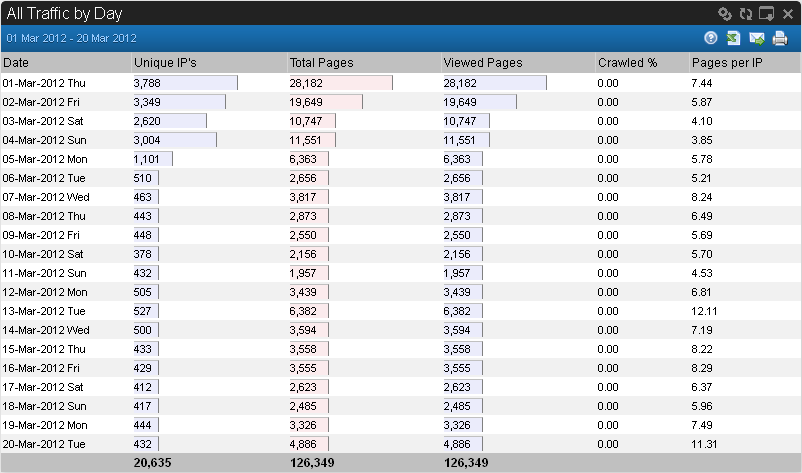
The All Traffic by Day report shows the following information by date for each day of the selected date range:
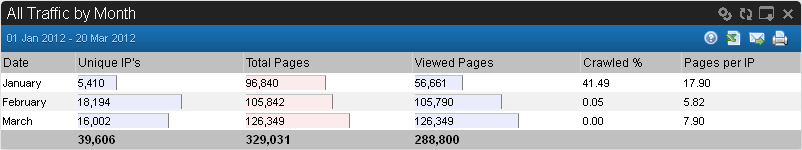
The All Traffic by Month report shows the following information by month for each month of the selected date range:
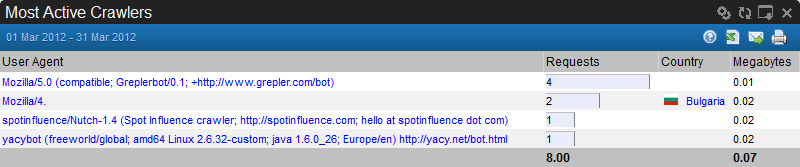
The Most Active Crawlers report includes the total number of requests (pageviews) made by a crawler or bot, the User Agent identifying the bot or crawler, and the country from which the IP number originated from. GeoIP data must be installed and updated before the country information is available. Logaholic captures most bots, but if the bot uses a regular browser useragent (e.g ‘Mozilla/MSIE6.0’), Logaholic may not identify it as a crawler/bot.
Bots and Crawlers are software programs that visit your web site. They appear like normal visitors, following links on your pages, but since requests generated by bots are not actually viewed by a real visitor, we don’t include these requests in reports where Logaholic lists Pageviews or Visitors.
The most common crawler to your site is likely to be Googlebot (in several variations). Activity on your site from Googlebot is good news because it means that your web pages are being indexed in the Google search engine! It may also be helpful to note that Mediapartners-Google is the crawler Google Adsense uses to determine relevant ads for your webpage.
This report will also show you if search engine crawlers (also called spiders) can find all of your pages. If you don’t see any activity on certain pages you want indexed, make sure there are enough regular links on other sites leading to those pages.
There are some bots that you want on your site, like Google’s. But others may have shady intentions, like automatically capturing your site content or spambots searching for your customers’ email addresses. Some Bots like ‘Snoopy’ are software programs anyone can run, so keep an eye out for bots that may be putting an unnecessary load on your server. Any Bot, good or bad, can cause havoc on your server if it gets caught in a loop.
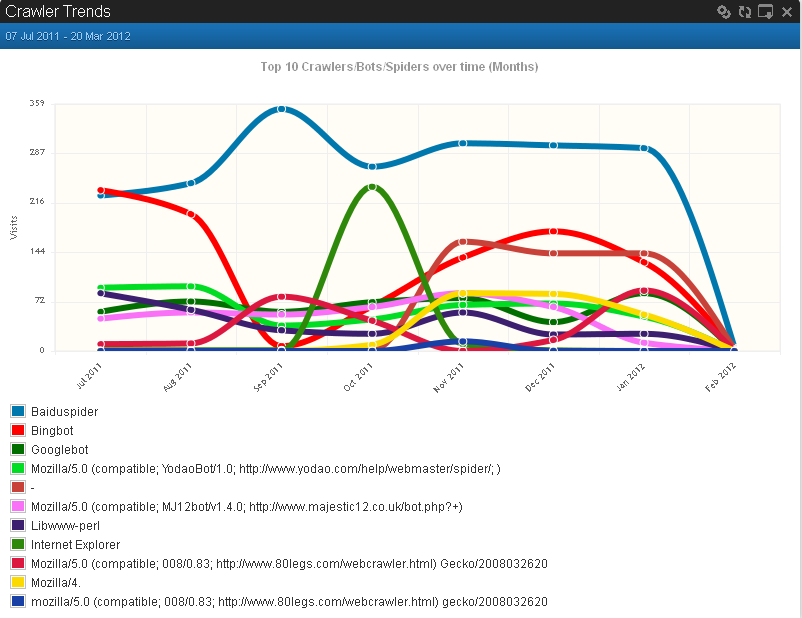
The Crawler Trends report provides you with information about the frequency of crawler activity for the different crawlers on your site, including the top ten most active crawlers.
It is helpful to know which crawlers are most active on your pages, because ultimately the crawlers determine your site’s ranking on SERPS (Search Engine Results Pages). Therefore you need to make sure that the crawlers you want (such as GoogleBot) crawl the pages you want. In some cases you might want to keep some pages (for instance, your site statistics) “hidden from crawlers.” Seeing which pages are regularly crawled can help you determine which pages to keep hidden.