Get Started
Company
Copyright © 2022. Logaholic Web Analytics BV
Below you will find a short explanation of each of the performance reports.
Available Reports
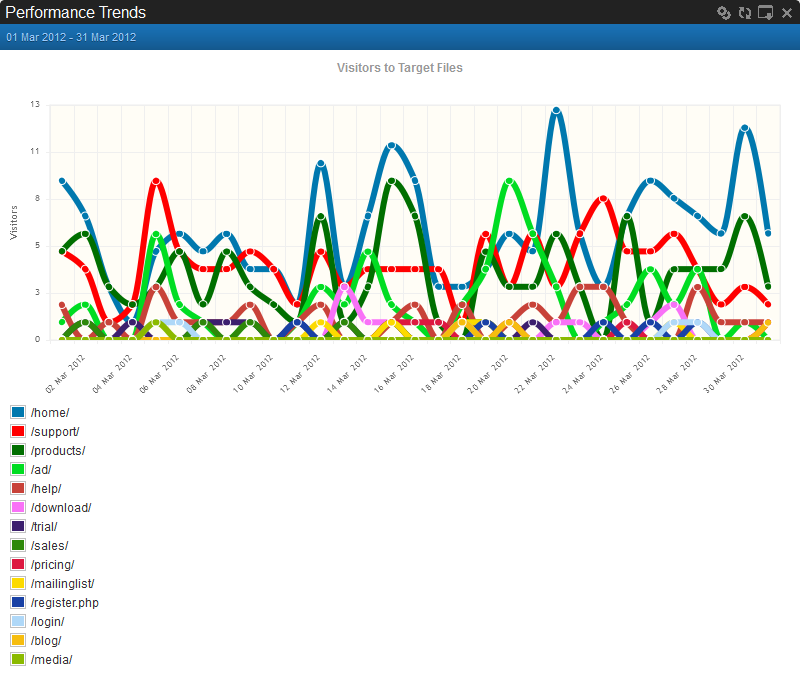
Performance Trend reports provide you with unique insight into the traffic visiting the Target Pages you defined as Key Performance Indicators. These pages may include a final shopping cart page, the final page of a registration process, or a subscription form. Generally, they represent some form of conversion from visitor to customer or subscriber.
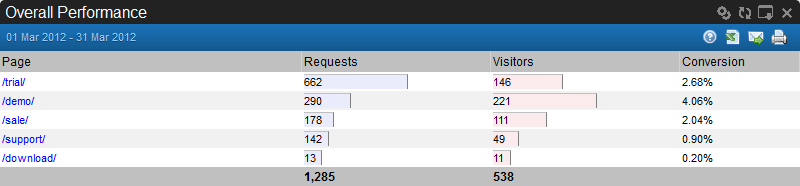
The Overall Performance report helps you track the overall performance of your website by showing you the number of visitors who “converted” from visitors to buyers or customers and what percentage that represents of your overall site visitors. The “conversion rate” is measured by the percentage of visitors who navigate to the target page you defined and complete an action that fulfills the goal of your website. This may be the final step of a purchase, a subscription, a request for a quote, an order, or any other action that completes this process. This report shows you the number of visitors who completed that action on that particular page and the percentage of overall visitors they represent. Depending on the nature of your website, you may have more than one target page that you wish to track.
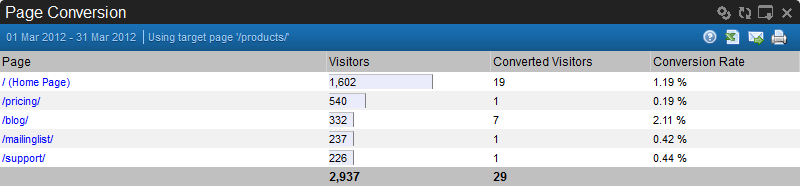
The Page Conversion report shows you the exact number of converted visitors per target page. An important feature of the report is that it also shows you the conversions per entry page, so you can see if the first page your visitors enter on your site plays a role in conversion. The report also includes the average length of time it took for visitors to convert.
Note: This report only shows conversion of the entry page. To find our which other pages influenced the conversion process, check the Road To Sales report.
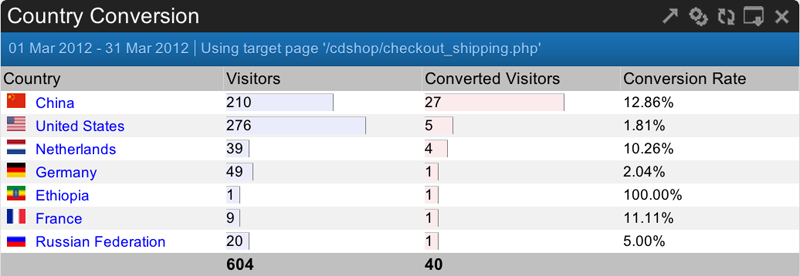
The Country Conversion report shows the number of converted visitors per country. This report tells you in which countries your site is popular. You can use this information for example to adjust your marketing strategies.
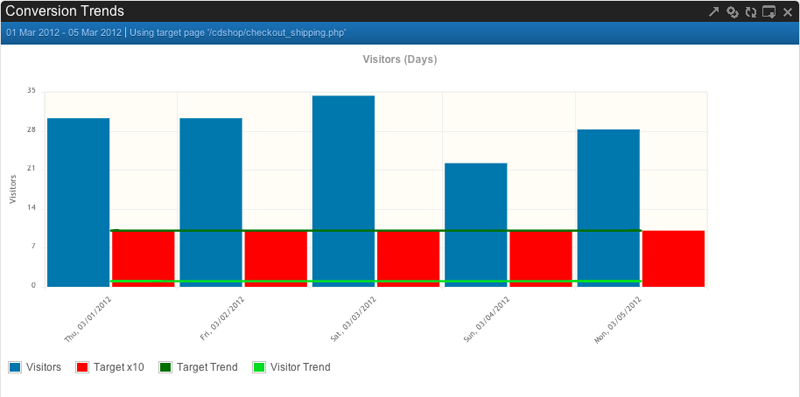
This report displays the conversion rate of each of your Target Pages over time. The conversion trend line shows whether your overall conversion rate is increasing or decreasing.
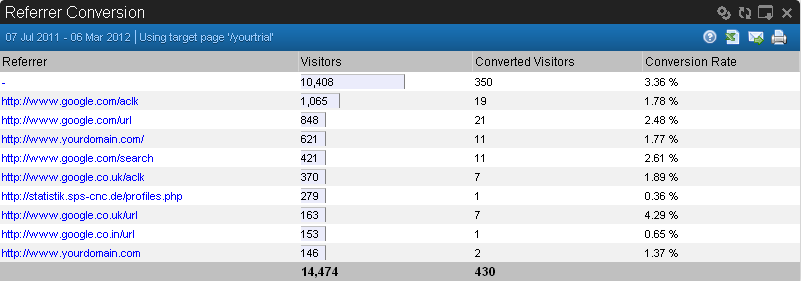
The Referrers Conversion report shows the number of converted visitors per referring site. This report tells you which of your referrers is actually doing a good job bringing valuable traffic to your site.
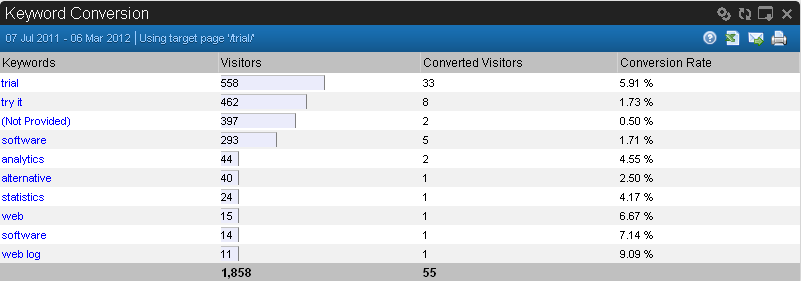
The Keyword Conversion report shows the number of converted visitors who navigated to your site using a particular keyword. Knowing your most valuable keywords can save you from paying for keywords that do not bring converting visitors to your site.
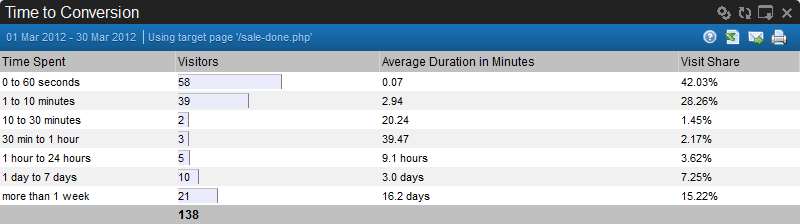
The Time that visitors need to navigato To a target page (Conversion) is a perfect indicator of website efficiency. In other words, this report enables you to see if your visitors reach your target pages fast enough. Time to Conversion shows an average number.
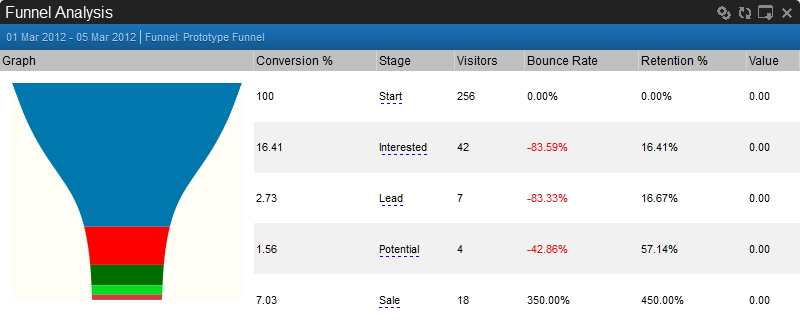
A Funnel Analysis Report allows you to define, analyze, and measure the stages a visitor goes through on your website from first entry to final sale. Such a reports gives you a graphic representation of how many visitors entered your site at a certain page and how their visits progressed from there to your “target” page. The goal is to provide you with information on which “stages” your visitors leave your site or exit the your funnel, so you can make whatever changes are necessary to keep them on the pate necessary to reach your target page.
A “Sales Funnel” is a way of visualizing the sales process of a company’s website. In Logaholic, we use this model to visualize any process leading up to an important event on your website (like a purchase or a newsletter subscription). The graphic representation of this process is designed to emphasize the volumetric changes in numbers as your visitors move through your defined stages.
An Example of a Sales Funnel:
You can also create funnel reports to track visits through different variations of your site’s pages. If you place both versions of these pages online side by side, you can direct some people to Page A and others to Page B. After this test has run for a time, you can check the performance of each variation of your test page by comparing the number of visitors finally converting to your target pages from each variation.
When you click on “Create New Funnel,” three empty fields appear, allowing you to define the stages and the specific pages that represent the funnel leading to your target page.
In order to create a funnel report, you need to specify the visitor page each stage of the funnel should represent. Each “stage” is defined by a specific web page that your visitors need to navigate to on their way to your final target page (such as a sales confirmation page). You may want to know, for example, how many visitors to your site proceed to the page where they purchase and download your software. In the first Pages field you could enter “Any.” to count all visitors coming to your site from any page. Then, by clicking on the plus button, you can add subsequent pages in order to track your visitors progress (and the success of your pages in leading your visitors to becoming customers). As another example, you may be interested only in the performance of visitors who come to your site from Google. To do this, you would enter the Google search URL in the first or second “Page” field. Then, you can add more parameters (pages) to your funnel, creating a measurable path to your target page (the URL representing a sale, a subscription, registration, or whatever you may be measuring.)
As you create your funnel report, be sure to label each page you add. Each label should describe clearly what you are measuring. In the case of a sign up for a newsletter, for instance, the label could read “Interest level.”
An important function of funnel analysis is that it provides you with measurable results in terms of money spent and earned. When you set up the funnel, you can add a value to each parameter. For instance, if you advertise on other sites, every visit to your landing page will cost you money. As you create your funnel report, you can enter, for example – $0.50 (your advertising cost) as the “value” for the URL of your landing page. In the last stage representing your final target page, depending on the value of your products, you could enter the average price of each item. ($100.00)
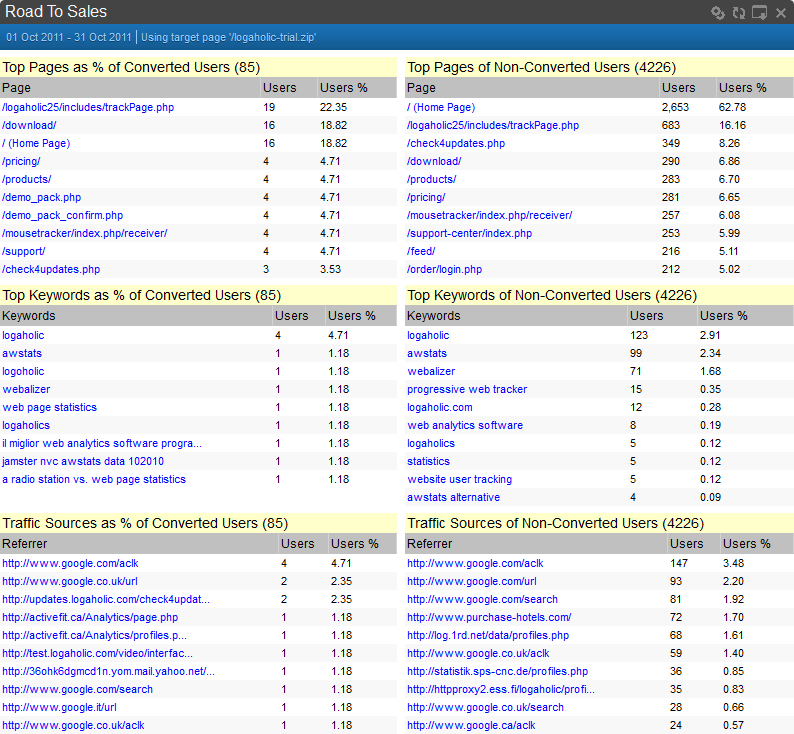
The Road to Sales report shows you the three most important values for evaluating the performance of your website: your keywords, pages, and referrers. A separate report of keywords, pages and referrers shows you those that resulted in the most conversions and those that resulted in the fewest. This allows you to easily eliminate the worst performing keywords, pages, and referrers from your marketing efforts.
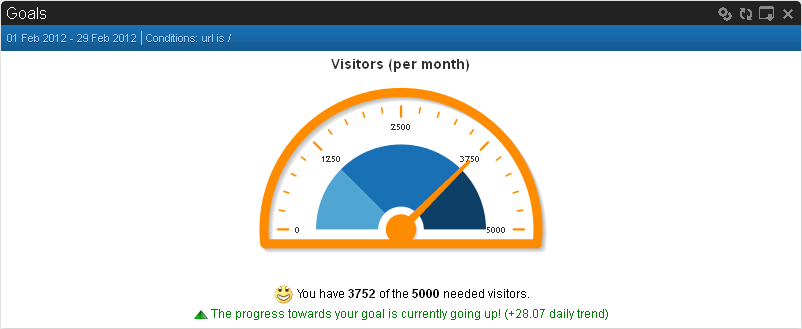
Goals are essential if you want to take your website to the next level. With this report you can create targets for any page that you like. Goals/targets can be applied to visitor numbers, pageviews and conversion. Goals displays your data in an easy-to-read overview.