Get Started
Company
Copyright © 2022. Logaholic Web Analytics BV
Logaholic offers a very broad collection of web analytics reports. We devided them in the following categories:
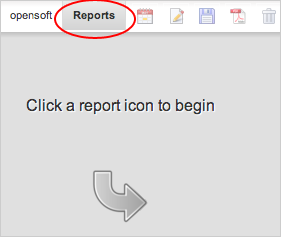
Logaholic reports can be accessed through the “Reports” tab in the top menu.
More and more people and businesses have information scattered all over the web. Logaholic makes it really easy to view those information sources all at once. You can create your personal Dashboards, from where you can access your website statistics, social media stats, and for example e-commerce reports. Read more..
Logaholic reports share a few general settings that you can apply in the report settings. Read more..
Many reports in Logaholic can be exported to a CSV file, sent via email, or displayed in printer friendly format. It is also possible to save your workspace as a PDF. Read more..
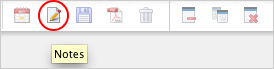
Within Logaholic you can make notes describing changes in your website traffic patterns; explanations for a test you’re running, or notes about the URL parameters, keywords, or other filters you’re applying in reports. When you’re tracking changes in your website traffic, making notes will help you recall the events or circumstances that influenced your traffic.

For example, let’s say you’ve started a new online advertising or promotion campaign. Later on, you might notice an increase in visitors from a certain referrer or country. A note will remind you what was responsible for this change.
All Notes are linked to a date. Relevant notes will automatically appear at the top of the screen if the note’s date is within the active report’s date range.