Get Started
Company
Copyright © 2022. Logaholic Web Analytics BV
Below you will find a short explanation of each of the visitor details reports.
Available Reports
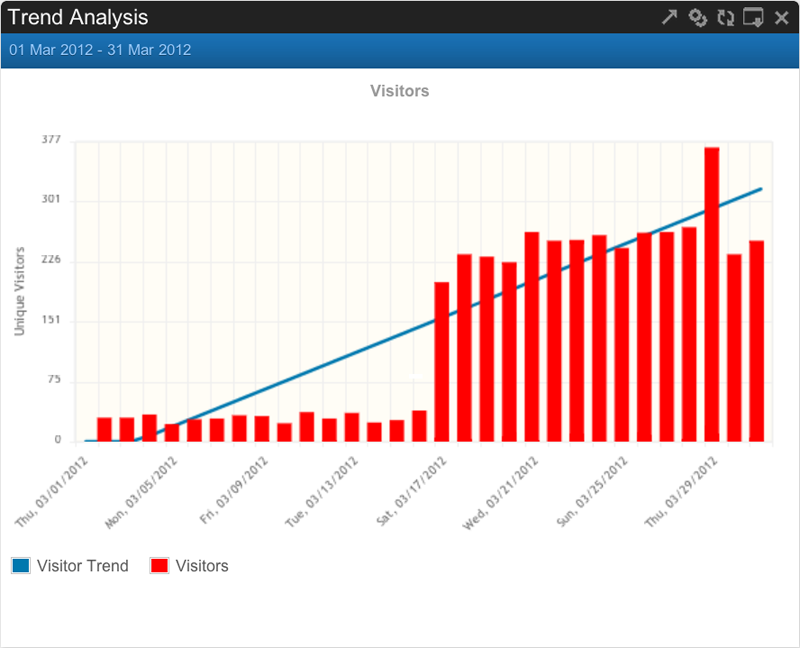
This report shows you the trends in visitors on a certain page, for a specific keyword or for a referring site. In the report settings you can enter the page, keyword or referrer that you want to see stats for. When entering pages, always start with a slash. You can also choose wheter you want the report period to be displayed in days, weeks or months. By default, a barlinechart will display your trends. It is also possible to view the numbers in a table.
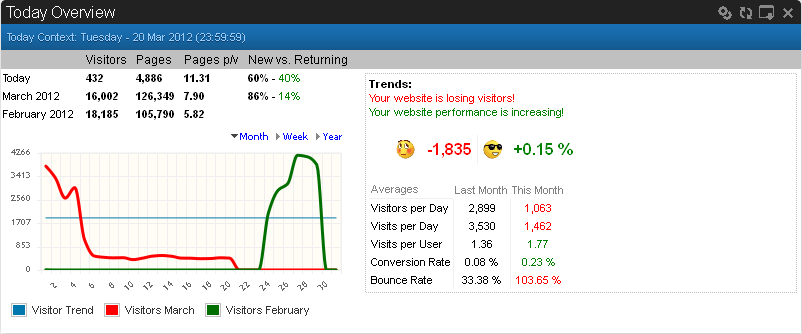
The Today Overview screen provides a quick overview of your site’s performance today. However, you can also view your site’s performance for yesterday or for any available individual date by entering that date in both the “from” and “to” fields when choosing a date range. A month after Logaholic is first installed, you can also see the history of your site’s performance over the prior 31 days.
Above the chart itself, you’ll see a table that includes the number of visitors, the number pages viewed, the number of pages per visitor, and the ratio of new verses returning visitors. This information is summarized for the selected date, for that month, and for the prior month, providing a quick way to compare the performance of your site in the current month to the previous.
The Trends chart, shown above on the right, is a sort of “thermometer” display for your website. In one quick look you can see if your site’s visits and visitors are increasing or decreasing, and what the conversion and bounce rates are for the current and previous months.
The Overview screen provides three options for displaying your visitor data.
Month:
The Month chart includes two lines of data showing the number of visitors for each day, one for the current month and one for the prior month. As you move the cursor across either of the two lines, you can see the number of visitors for that day of that month.
Week:
The Week chart provides you with an easy way to visualize your site traffic by day of the week for the current month. For each day of the week (Monday through Sunday), the chart shows four bars, one for each week of the month, showing the number of visitors for that day. As you move the cursor across the bars, you can see the number of visitors for that day of the week during that week.
Year:
The Year chart shows your website traffic for the current and past twelve months. This visual display allows you to quickly compare your website traffic between years. As you move the cursor along the lines of the chart, you can see the number of visitors for that month.

The Visitors and Visits report displays the date, the number of visitors, the number of visits, and the average number of visits per visitor on that date. These charts show unique visitors for the selected period of time. Since a visitor may be unique within a particular week, but not necessarily in a reviewed hour, you cannot simply add totals across reports.
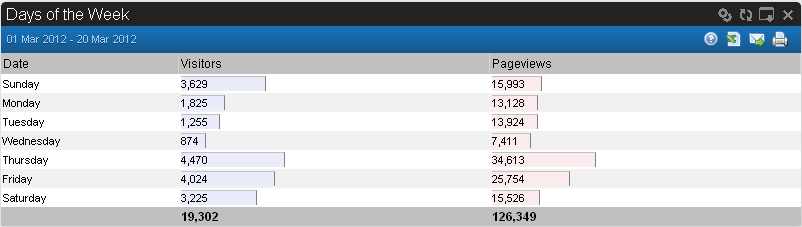
The Days of the Week report displays the date, the number of visitors, the number of visits, and the average number of visits per visitor on that date. These charts show unique visitors for the selected period of time. Since a visitor may be unique within a particular week, but not necessarily in a reviewed hour, you cannot simply add totals across reports.
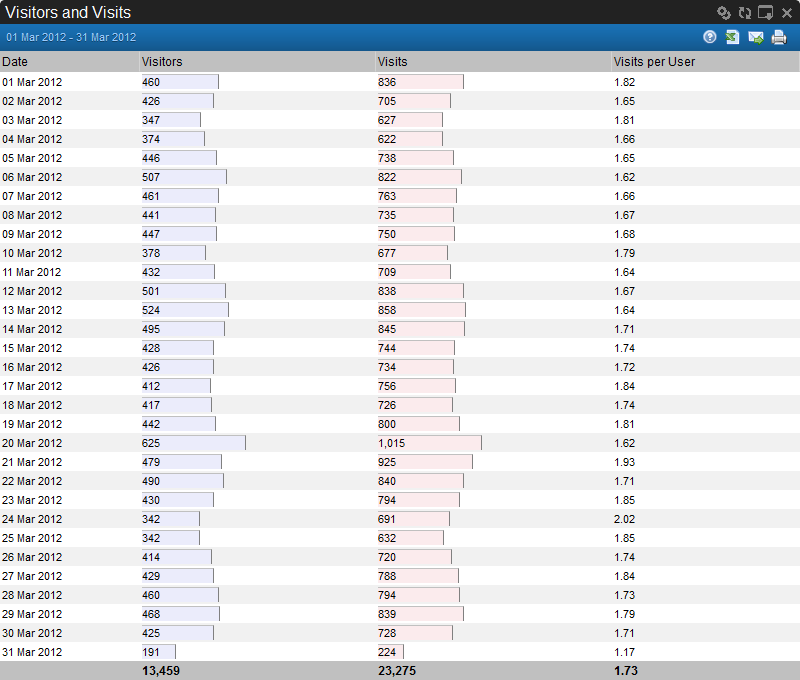
The Visitors and Visits report displays the date, the number of unique visitors, the number of visits, and the average number of visits per visitor on that date.
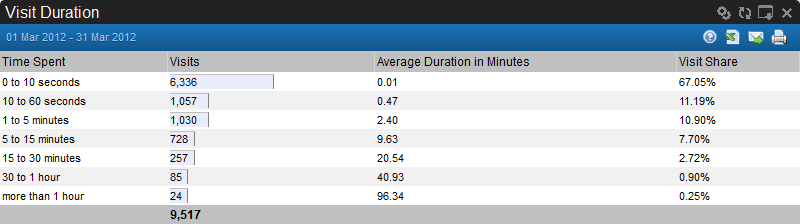
The Visit Duration report displays the time spent by visitors on your site using the seven categories shown for visit duration. How long your visitors stay on your site each time they visit can be an important measure of your site performance.
0 to 10 seconds
10 to 60 seconds
1 to 5 minutes
5 to 15 minutes
15 to 30 minutes
30 to 1 hour
more than 1 hour
For instance, the report may show a statistic like “72% of 639 visits fall into the 0 to 10 seconds duration bracket. This means that 72% (or 639 visits) of all visits to your site lasted under 10 seconds.
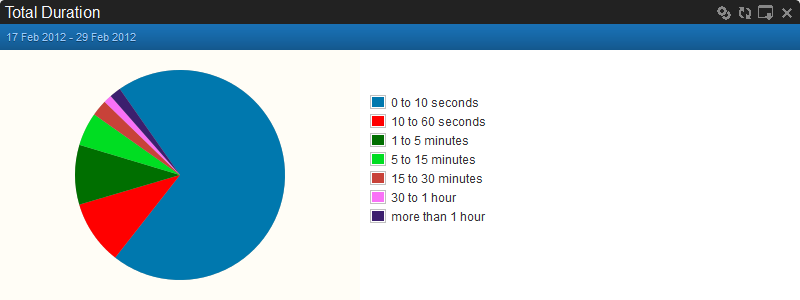
The Total Duration report shows the visit duration per visitor, rather than per visit. Since one visitor may have more than one visit to a site, the Total Duration report summarizes the total duration a visitor has spent on your site for all visits. How long visitors remain on your site over a period of time can also be an important measure of your site’s performance.
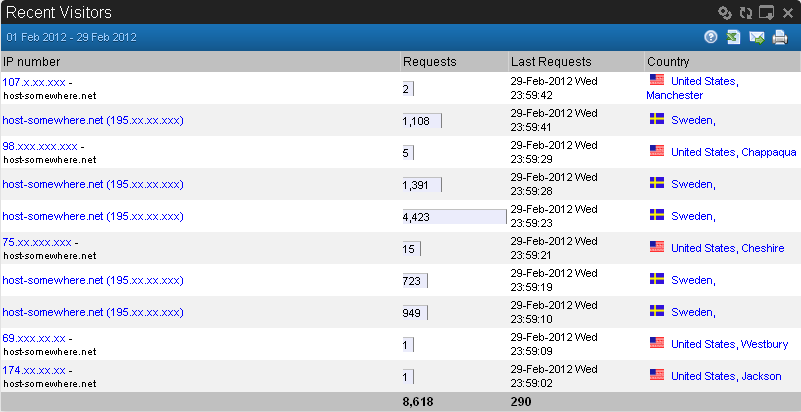
The Recent Visitors report shows the total number of requests (page views) per visitor of the most recent visitors to your site, their IP number, the date of their most recent page request, and the country/city from which each visitor accessed your site. A special report option lets you search IP numbers that either “match”, “equals” or “don’t match” your search query.
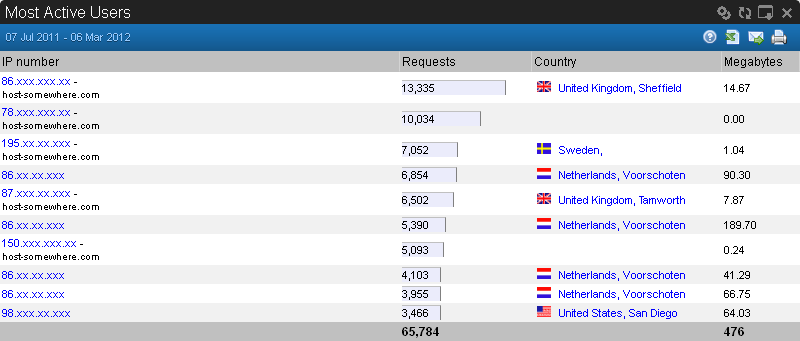
The Most Active Users report shows the IP number of the most active visitors to your site, the total number of requests (page views) per visitor, the country/city from which each visitor accessed your site, and how much total data (in MB) was transferred by the user during their visits to your site. Knowing your active users and where they came from may help you better customize your visitors’ experience. For example, you may have information that tells you it may be helpful to your users to allow them to select a country when they enter your website, or information to help guide your marketing efforts. A special report option lets you search IP numbers that either “match”, “equals” or “don’t match” your search query.
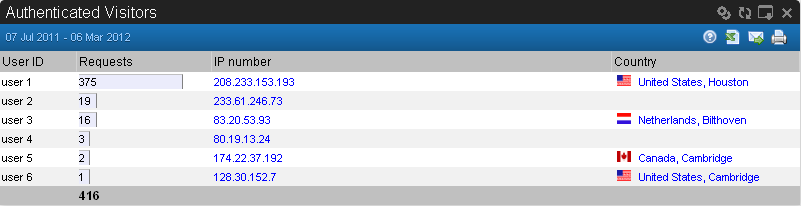
The Authenticated Visitors report displays the date of the most recent visits to your site, the visitor’s IP number, the country from which each visitor accessed your site, and the number of page views (requests) per visitor. The report also includes the User ID (the Authenticated Username) of your site’s visitors.
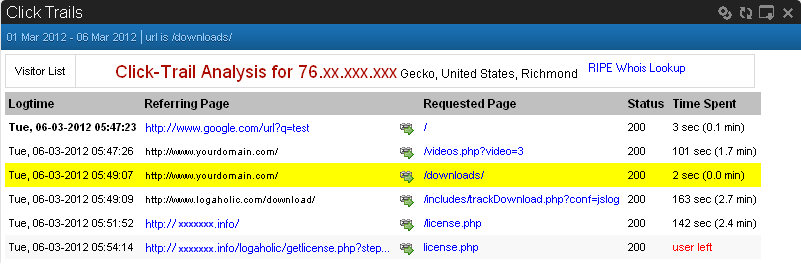
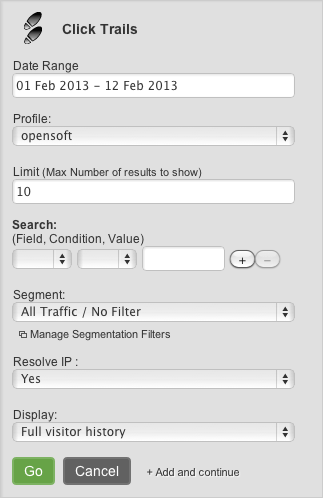
The Logaholic Click Trails feature allows you to view the entire history of a selected visitor as he navigates through your website (also referred to as the “Clickstream”). The Search form, shown below, allows you to enter criteria for tracking a visitor by IP address, referring URL, query string parameters, even which browser the visitor used. There are ten different criteria from which you can select, making it possible to locate and track a specific visitor all the way through your site, select a specific page and track all the visitors to that page, or track the visitors sent to your site from a specific referrer. You can also narrow your search by date range, limit the number of visitors you wish to include in the report, and even apply Segmentation filters to your search.
If, for example, you wish to track the click trail of a particular visitor, you can enter that visitor’s IP address in the search field. The Click Trails Analysis report shows the log time (the time the user clicked on the page), the referrer (if applicable), the page the user requested, and how much time the user spent on the page. The report provides a great deal of information about the visitor, including the operating system and browser they used, the city from which they’re accessing your site, even a home address and telephone number if available. Imagine the wealth of information this one simple report provides for customizing and personalizing your visitors’ experience on your website.
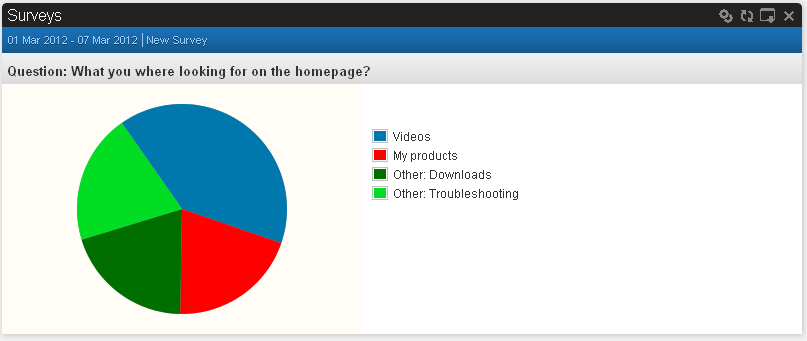
With the Surveys Report you can create your own surveys in the Logaholic software. It is easy to use. The report creates an I-frame output that you can simply paste into your website. Open the Surveys Reports and click “Create/Edit a Survey” to start with your own Surveys.