Get Started
Company
Copyright © 2022. Logaholic Web Analytics BV
Below you will find a short explanation of each of the popular content reports.
Available Reports
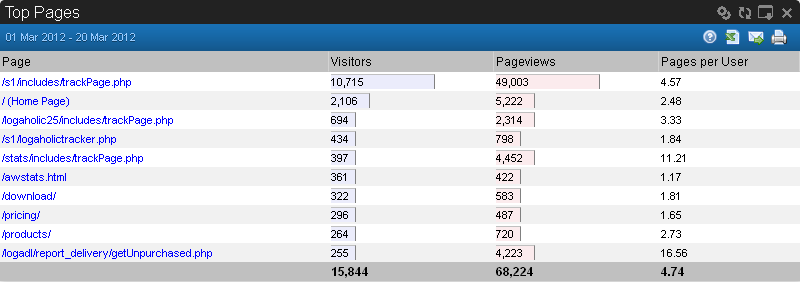
The Top Pages report shows a list of the pages that were most viewed by human visitors. It displays the number of visitors each page has gained over a certain timeframe and how many times the page has been viewed.
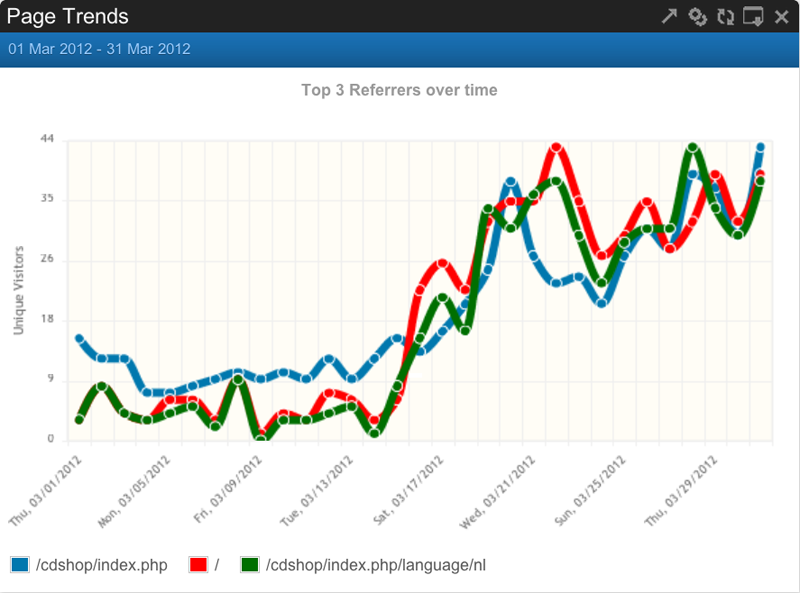
Monitor the trends in visitors for the most important pages on your site. This report splits up in days, weeks and months. With help of a graphical presentation, you will see immediately which pages perform better or worse than the average.
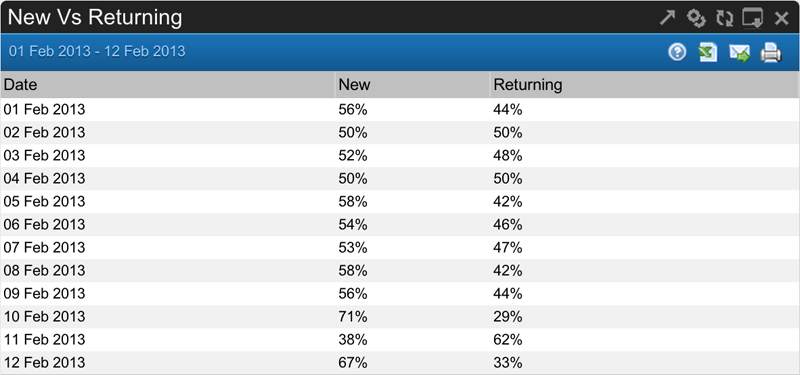
New versus Returning displays which percentage of your total visitors reached the site for the first time (e.g. was “new”) and which percentage was “returning”.
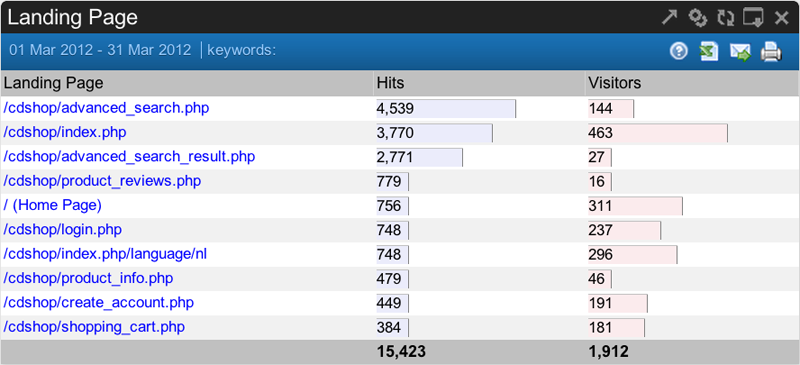
Landing Pages are pages where visitors enter your website. This report shows the most important landing pages with corresponding visitor numbers. Through the report options it is possible to drill down on a certain keyword or referrer. This way you will be able to see on which pages people enter when using a certain keyword. Another option in this report is the ability to see URL parameters.
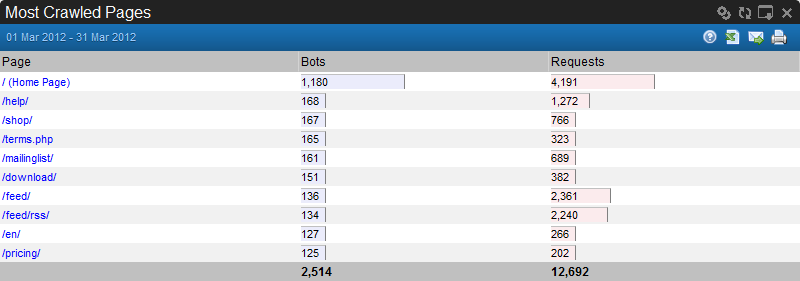
Most Crawled Pages shows how many times your site is visited by so-called ” search engine bots”. Those are virtual visitors looking for new pages on your website. Every time a bot hits a page, this is counted as a pageview.
Site errors can cause people to leave your site, or never reach it in the first place. See the video below and learn how you can use Logaholic to eliminate site errors.
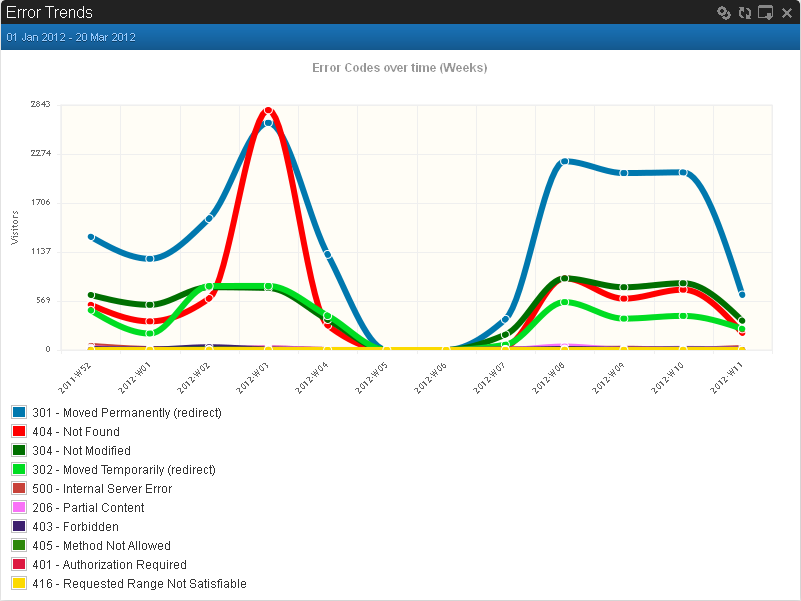
Error Trends speaks for itself. With this report you can see the trends in errors that appeared on your site.
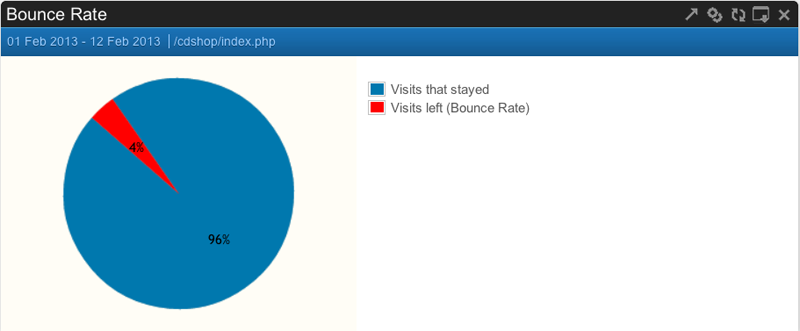
Bounce Rate represents the percentage of visitors who enter the site and “bounce” (leave the site) rather than continue viewing other pages within the same site. The report gives you the option to drill down on a specific page. You can enter the name of the page starting with a slash.
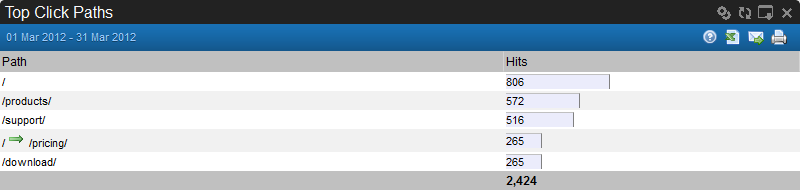
The Top Click Paths report displays the most popular sequences of pages viewed by visitors on your site and the number of times a visitor used this path. We recommend using this report in combination with the Page Analysis report, because it is difficult for a single report to define the click paths that lead to higher conversion rates.
This report shows which pages were opened after visiting your site. To see this, you need to implement a Javascript tracker in your website. The code is provided in the “Edit Profile” menu of Logaholic, clicking the “Advanced” tab.
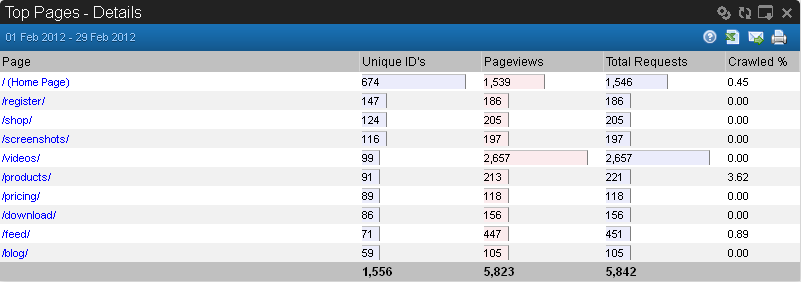
The Top Pages Details reports is a more detailed version of the Top Pages report. However, it also includes a count of the authenticated users (those who have accessed your website using their unique User ID) who visited these top pages, the number of times a page was viewed by human visitors, and the percentage of crawler views of the page.
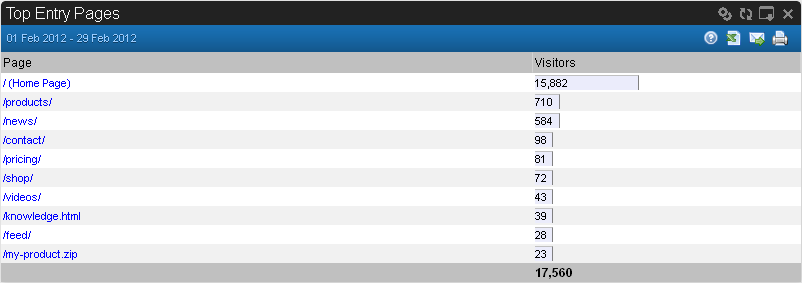
The Top Entry Pages report shows the top entry pages (the first page requested by a visitor to your site) and the number of visitors for whom this was a top entry page.
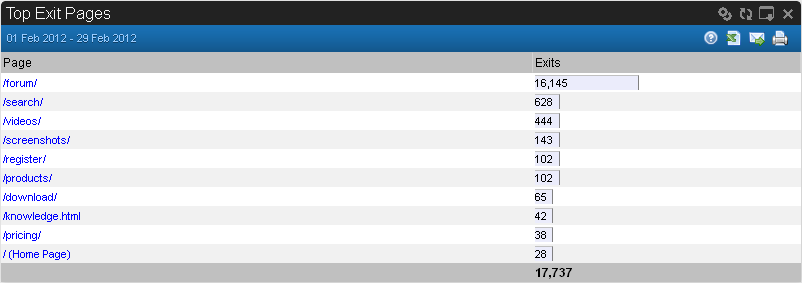
The Top Exit Pages report shows the top exit pages (the last page a visitor requested on your site) and the number of visitors for whom this was a top exit page.
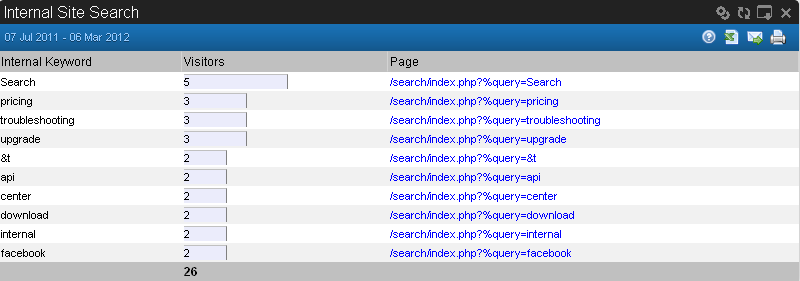
The Internal Site Search report is particularly useful if you have a “Search” option on your website. The report displays the keywords used by visitors when they search for content or products on your site. This provides you with great insight into what visitors are looking for once they are on your site. It can also help you determine whether or not you may need to include an advanced search option on your website if you consistently return a large number of unfiltered results and your users do use those results as you expected.
To run this report, enter the URL of your search page in the “Search Page” field provided so that you can define which page and parameter on your website handles internal search queries.
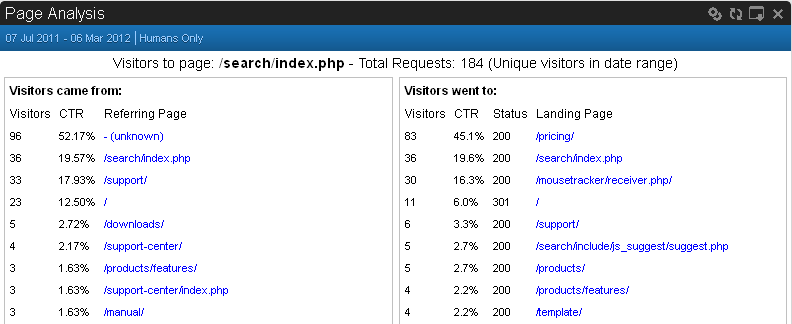
The Page Analysis report provides an overview of traffic to and from a particular page on your website, to aid in evaluating that page’s performance.
To view the Page Analysis report, select both a “Date Range” and the “Page” you wish to analyze. To select a page, simply type its name in the Page field. If you leave the Page name blank, the analysis will default to your website’s home page.
The most interesting and useful information appears on this report when you select a specific target page in the “Page” field. When the statistics are updated for this page, you can actually see the name of the previous page from which your visitors navigated to the page you selected. You can also see the next page within your site that visitors navigated to after the page you selected. The report shows the percentage of visitors navigating from the selected page to another page on your website may not total 100%. The assumption is that the remaining visitors exited the site from the page you selected.
There are three specific options available to this report.:
Status Codes: The default status codes for this report are 200,302. Find out more about Status Codes in the Web Analytics Definitions section of this Manual.
Traffic: The type of traffic you wish to analyze on this page: All (Humans+Bots), Humans Only, or Bots Only.
Parameters: Check this box to includ exact referrers and pages (including any parameters) in the analysis.
If you don’t select a specific page for the Page Analysis report, it displays the analysis for your home page (index “\”).
The page analysis is divided in two sections: “Visitors Came From” and “Visitors Went To.”
Visitors Came From:
If you run the report for your home page, this list will include the visit counts only for referrers/external websites. If the report is run for a different page on your website, the list will include the page names and visitor counts for visitors who navigated to your selected page from other pages within your website.
Visitors Went To:
This list includes the name of the pages on your website that visitors navigated to after landing on either your home page or the page you selected for this report. The analysis includes the count of visitors who navigated to the next page, the percentage of visitors, and the name of the page (the ”’Landing Page”’) to which they navigated. The report also includes a count of visitors who probably exited your website from this page.
Normally, the numbers shown in the “Visitors Went To” section do not add up to 100%. The assumption is that the visitors who did not navigate to another page on your website exited the site. So at the end of the report, you’ll see the following message: “Page exit ratio (or bounce rate per page):” followed by the remaining percentage.