Get Started
Company
Copyright © 2022. Logaholic Web Analytics BV
Almost any Logaholic report offers the setting “Display Mode”. With this setting you can choose in what graphic presentation you want your data to be displayed.
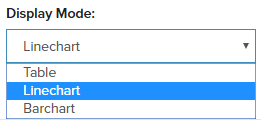
Possible display options are: Pie, Table, Barchart, Linechart and Barlinechart.
In each bar chart, line graph, and pie chart, moving the mouse across the line, bar, or section of the pie displays the associated value.