Get Started
Company
Copyright © 2022. Logaholic Web Analytics BV
Logaholic provides a wide variety of reports to give you an overview of the traffic, performance, and visitors to your website. The following instructions provide you with the information you need to develop your own custom reports.
Every report class extends the master Report class where we make available a number of functions you can use in creating your own custom reports.
The “Report Array” includes all of the Logaholic reports. By adding your custom report to the Report Array, the name of the report will be included automatically in the report panel. By adding your report label as shown below, we can retrieve the report automatically:
 $r = new $reports[$clabel]["ClassName"]();
 $r->DisplayReport();
Class Constants
The report uses constants for labeling and collecting the reports from the reports array. Within the reports array you must make use of constants. You will need to make sure you define them before you use them.
 define('_MY_REPORT', 'My report');
 define('_CUSTOM_REPORTS', 'Custom Reports');
Reports Array
The first thing you need to do before starting the develop your class is to add your report to the $reports array. This array is used within Logaholic to retrieve and display your report.
To create a new report, your array needs to define: the name of your class, the category in which your report should be shown, the icon of your report, and the report options.
If you do not have an icon for you report, you don’t have to add “icon” to the array. A custom icon can be added to it.
The “Options” within this array are used to create the Report settings/options. This does not include your custom options.
$reports["_MY_REPORT"] = Array(
  "ClassName" => "Myreport",
  "Category" => "_CUSTOM_REPORTS",
  "icon" => "images/icons/32x32/myreport.png",
  "Options" => "daterangeField,limit"
);
Available Options in the $reports array:
| Options | Notes |
|---|---|
| daterangeField | When enabled, the user can choose a daterange for the report. Which can be used in the report with $this->from; and $this->to; |
| limit | The user can set a limit for the amount of data they want to view. For example: if the user inserted 10 in the limit you can used this with an if statement using $this->limit; |
| trafficsource | Sets an trafficsource option field so the user can choose a trafficsource that you can use in the report by calling it with: $this->trafficsource; |
| roadto | Choose a KPI which you can use in your report. |
| internalsitesearch | The user can insert their own internal site search url |
| search | Adds a search box where you can do a search that matches the input given by the user |
| searchmode | Adds an select box to the search options where you can select if your search should or should not contain the given search value |
| columnSelector | Useable only when using tables. This option lets you hide/show your columns |
Be sure that the “ClassName” you have inserted in the array above matches the name of your Class and also make sure you extend the Report master class.
Class Myreport extends Report{

}
All Class variables are called by using $this-> as a prefix in front of the variable.
For example: $this->from; $this->to; $this->limit;
| Variable | Value | Notes |
|---|---|---|
| from | Timestamp | This contains the from timestamp that you get from using a daterangeField |
| to | Timestamp | This contains the to timestamp that you get from using a daterangeField |
| limit | Number | This contains a number which can be used to set a limit |
| labels | String | This contains the report name |
| paginationPanel | Boolean | This is a toggle to show the pagination panel under a report or not. |
| sortTable | Boolean | If this is set to false, no javascript datatable plugin will be activated |
| help | String | This contains the help text for a report |
| displayHeader | Boolean | controls if we want to display a report header (default true) |
| displayReportLabel | Boolean | controls if we want to print the report name in the header (default false) |
| addlabel | String | this can be used to add custom text to the report options list in the header |
| customHeaderContent | String | replaces the list of report options in the header with a custom string (default empty) |
| displayReportButtons | Boolean | controls if we want to print report buttons in the header for help, print, export, email etc. (default true) |
| graphcolors | Array | contains the colors of graphs and pies. |
| profile | Class | This class holds all the information about the currently active profile |
| columnDefinitions | Array | An array containing the definitions for each column in the report. (More below) |
columnDefinitions is an array used to define each column in a report.
Example: $this->columnDefinitions[] = array(“Label” => “Visitors”);
Below is a list of the options you can use.
| Option | Value | Notes |
|---|---|---|
| Label | String | Defines the name of the column. |
| totalRow | String | Defines what kind of total should be shown at the bottom of the table. No total (‘none’) Average Total (‘avg’) Total Sum (‘sum’) Weighted Average (‘weighted-avg’) |
| weight-row | int | Used only in combination with totalRow=weighted-avg. Defines which column is to be used as the ‘weight’ in the average calculation |
| search | Boolean | The search of the report wil look into this column. Only one column can be searchable!(default false) |
| dataType | String | Defines the type of data in this column for sorting. If set to ‘String’ it does not sums the data.(“auto”,”Numeric”,”String”,default “auto”) |
| disableShowfieldsHandling | Boolean | (default false) |
| bchart | Boolean | Defines if the column should be displayed as a horizontal ‘bar chart’ in the table (default false) |
| display | Boolean | Defines if the column should be shown in the table.(default true) |
| urldecode | Boolean | Urldecode de data in this column. (default true) |
| actionmenu | String | Adds a actionmenu to each entry in this column(default “”) Options: page,keyword,referrer,params,ip |
| displayMaxChars | Number | controls how many characters of urls, keywords, etc. are displayed in report tables, legends etc. (default 100) |
| Class | Notes |
|---|---|
| report_option_field | For the form elements to work in DisplayCustomForm() the elements must have this class. |
| open_in_new_dialog | For using this class we also need some attributes: href for the target url with the options, type attribute for the label, name attribute for the reportname and the rel attribute for the php class name. this can be used in combination with ‘quickopen’. |
| open_in_this_dialog | For using this class we also need some attributes: href for the target url with the options, type attribute for the label, name attribute for the reportname and the rel attribute for the php class name. this can be used in combination with ‘quickopen’. |
| quickopen | used with open_in_new_dialog and open_in_this_dialog, with this the new report instantly opens. Without this you will open the report option screen. |
| open_iframe_window | href= url with the needed options |
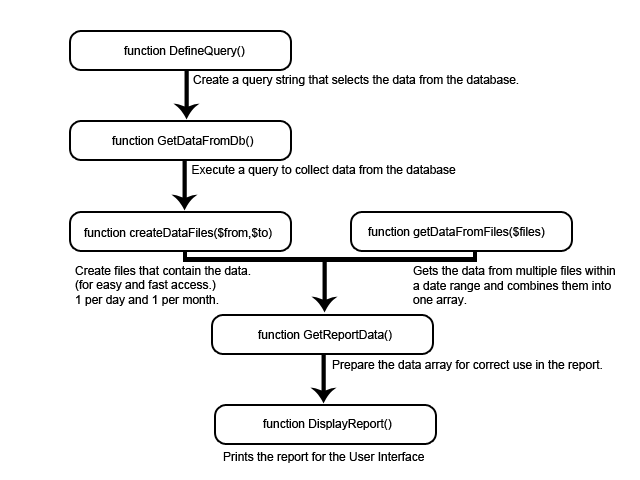
If you want to create a report with logaholic data you only need to use DefineQuery() in your report. You can also use custom data, for that you only need GetReportData()
Settings
function Settings(){}
Here we define what the report should or should not show, we define the names of each column , description and the addlabel variable.
Most class variables are set in this function. Some are used in the report such as $this->from and $this->to, but the boolean variables are all used in this function.
function Settings() {
    $this->columnDefinitions[] = array("Label" => _LOCATION);
    $this->columnDefinitions[] = array("Label" => _USERS, "bchart" => true);
	$this->help = "The description of this report goes here";
	$this->addlabel = "label shown in the report header";
}
In the showfields variable we define the names of each column and seperating them by using a ‘,’ (comma).
The bchart array lets the master report class know wich column must show bars in the display.
function DisplayCustomForm(){}
This is an empty function where you can insert your input, select, links and more to get the information the user needs to supply as options for the report.
For every report, you can ask for user input in the Report options. The report options already have a few commands that can be use to get the information you need. For example, you can ask for a date range, a certain limit or search. In the example below, the user is asked to insert the name of a author. You can use this in your report whereever you need it.
function DisplayCustomForm(){
	return "";
}
Now when you need the author name you can simply call it in your class by using: $this->author; (where author is the name given to your input field.).
DefineQuery
function DefineQuery(){}
In this function you need to return a query that the report class uses to create a report with the data gathered with the given query.
The following example is used in the ‘Visitors per Day’ report:
function DefineQuery() {
    $query = "SELECT days, visitors, pages, (pages / visitors) ppu FROM
    {$this->profile->tablename_vpd} WHERE timestamp >= {$this->from}
    AND timestamp <= {$this->to} ORDER BY timestamp";

    return $query;
}
GetReportData
function GetReportData(){}
In this function you can create the data you wish to display in a report. You can use your own array with the data (Example: $import) at first.
For this function you MUST return a data array (Example: $data) as shown in the example below:
function Settings() {
    $this->columnDefinitions[] = array("Label" => _LOCATION);
    $this->columnDefinitions[] = array("Label" => _USERS);
}

function GetReportData(){
	$import["NL"] = 45;
	$import["FR"] = 0;
	$import["EN"] = 86;
	$i = 0;
	foreach($import as $key => $val){
		$data[$i][0] = $key;
		$data[$i][1] = $val;
		$i++;
	}
	return $data;
}
The build of the $import array is different in every report but the construction of the $data array is always the same.
The $data array has two arrays. The first array defines the row of the table it creates when it has been returned.
Within the first array there is a second one that defines what data there has to be shown in a certain column.
In the example above we create a table with two columns: _LOCATION and _USERS.
Inside the $data array these columns are called by the order they are inserted into the showfields string. In this case the $data[$i][0] stands for the: _LOCATION column and the $data[$i][1] stands for the: _USERS column. This returns us the following table:
| Location | Users |
|---|---|
| NL | 45 |
| FR | 0 |
| EN | 86 |
DisplayReport
function DisplayReport(){}
This function will print the report. By default, this function just prints a table, but this can be overruled in child classes.
You can use this to create a custom display different from the other reports.
function DisplayReport(){
echo "This header will be shown in the report
";
echo Create multiple divs and other objects that are will be shown";
}
Table
function Table($tabledata){}
Some reports need to show more than one table. A good example of this is the ‘Road to Sales’ report.
With this function you can create multiple tables with different data.
Below we create a display that resembles the default display of a report:
function DisplayReport(){
	$data = $this->GetReportData();
	$this->Table($data);
}
We first gather the data with GetReportData and then insert this into the Table function so we can have a table in our report.
PieChart
function PieChart($data = array(), $legendOrientation = "east", $legendDisplay = "block"){}
$data is an array that is needed in the format returned as in the GetReportData function. $legendOrientation is for the location of the legend in the report,
for this you have three options: 1-“east” this sets the legend left from the pie,
2-“west” this sets the legend left from the pie and as last 3-“south” sets the legend beneath the pie.
$legendDisplay is for the css of the legend.
Input for this can be: ‘block’,’inline’,’none’.
Graph
function Graph($data = array(), $graph_type = 'line'){}
This function returns a Graphic Display of your data.
The only thing this function requires is the $data in the format returned in GetReportData and you can choose the type of graph you wish to see.
The types of graphs are: ‘line’,’bar’,’area’.
ReportHeader
function ReportHeader(){}
This is mostly used in a DisplayReport function where you create your own display for a report. By just calling the function, you add the blue report header to your report.
SimpleStatsTable
function SimpleStatsTable($data,$from,$to,$showfields,$labels){}
This function needs data in the format given by the GetReportData() function.
It creates a simple table with the data it has been given for this you insert the date range the user has selected with $from and $to.
With the $showfields variable you define the name’s of each collumn. We use $labels to check the name of the report, this is needed to
see if the report needs certain restrictions.
XMLStatsTable
function XMLStatsTable($data,$from,$to,$showfields,$labels){}
This function needs data in the format given by the GetReportData() function. It creates XML output with the data it has been given. To do this, you need to insert the date range the user has selected in $from and $to.
With $showfields you define the name for each entry tag in the xml and $labels defines the id of the dataset tag in the xml.
CSVStatsTable
function CSVStatsTable($data,$from,$to,$showfields,$labels){}
This function needs data in the format given by the GetReportData() function. It creates a CSV file with the given data. The data in this file is the same as it is shown in a Table report.
seriesToColumns
function seriesToColumns($input_data, $row_key=0, $row_label="Date", $series_key=1){}
This function takes a series-based array and converts/pivots the array to columns.
It returns a array with two other arrays in it, a [fields] array that is used for the column names and a [data] array where the value is storred on the same position of a field within the [fields] array.
This function at least needs data to work. You can change the ouput with changing the default settings:
$row_key decides which row should be used as key in the arrays [data] array, this is used together with $row_label where you decide the labelname for this key in the arrays [fields] array.
$series_key decides which value must be used in the [fields] array.
Lets see an example of all this:
This is how our array looks like in the beginning.
But we want to make it so that we can see values for each day.
/*
Array
(
    [0] => Array
        (
            [0] => Thu, 12/15/2011
            [1] => (Not Provided)
            [2] => 2
        )

    [1] => Array
        (
            [0] => Thu, 12/15/2011
            [1] => awstats
            [2] => 2
        )

    [2] => Array
        (
            [0] => Thu, 12/15/2011
            [1] => awstats.pl
            [2] => 2
        )

)
*/
transform the data array to a column for each series
$data = $this->seriesToColumns($data);
We sorted the array on default row_key ‘0’ In this case that is the ‘Date’. The positions in [data] is the value of the position within [fields].
Example: [2] awstats: is the key with the value [2] => 2 from [data]
This is how our array looks now:
/*
Array
(
    [fields] => Array
        (
            [0] => Date
            [1] => (Not Provided)
            [2] => awstats
            [3] => awstats.pl
        )

    [data] => Array
        (
            [Thu, 12/15/2011] => Array
                (
                    [0] => Thu, 12/15/2011
                    [1] => 2
                    [2] => 2
                    [3] => 2
                )

        )
)
*/
get the column headers from the array
$this->fieldsArray();
getting the data from the data array
$new_data_array = $data['data'];
newReportArray
function newReportArray($rows,$collums){}
This creates an empty zerofilled array which needs the total rows and columns it needs to create.
$ncols = count($data['fields']);

$nrows = count($data['data']);

$seed_data = $this->newReportArray($nrows, $ncols);
This is mostly used together with seriesToColumns(); Where you can rebuild the $data array the way you want.
UpdateStats
function UpdateStats(){}
This is an empty function where you can place code that has to be executed when the Logaholic profile stats are updated. You can use this when the report needs to store data on a regular basis.
Visitors Per Day Report
Like the visitor per day report you can create a query report.
$reports["_VISITORS_PER_DAY"] = Array(
	"ClassName" => "VisitorsPerDay",
	"Category" => "_VISITOR_DETAILS",
	"icon" => "images/icons/32x32/visitorsperday.png",
	"Options" => "daterangeField,displaymode,trafficsource",
	"Order" => 3
);

class VisitorsPerDay extends Report {
	function Settings() {
		$this->DefaultDisplay = "table";
		$this->DisplayModes = "table,linechart,barchart";
        $this->columnDefinitions[] = array("Label" => _DATE);
        $this->columnDefinitions[] = array("Label" => _VISITORS);
        $this->columnDefinitions[] = array("Label" => _PAGEVIEWS);
        $this->columnDefinitions[] = array("Label" => _PAGES_PER_USER);
		$this->help = _VISITORS_PER_DAY_DESC;
	}

	function DefineQuery() {
		if (!empty($this->trafficsource)) {
			$query = "SELECT FROM_UNIXTIME(timestamp, '%d-%b-%Y %a')
                        AS days,COUNT(DISTINCT visitorid) AS visitors, COUNT(*) AS
                        pages,(COUNT(*) / COUNT(DISTINCT visitorid)) AS ppu FROM
                        {$this->profile->tablename} WHERE timestamp >= {$this->from}
                        AND timestamp <= {$this->to} AND crawl = 0 GROUP BY days
                        ORDER BY timestamp";
		} else {
			// Use the summary table.
			$query = "SELECT days, visitors, pages, (pages / visitors)
                        ppu FROM {$this->profile->tablename_vpd} WHERE
                        timestamp >= {$this->from} AND timestamp <= {$this->to}
                        ORDER BY timestamp";
		}
		return $query;
	}
}
Test example:
Below we have an example for a GetReportData report you can use this report for testing.
define('_MY_REPORT', 'My report');
define('_CUSTOM_REPORTS', 'Custom Reports');
define('_LOCATION', 'Location');
define('_USERS', 'Users');
$reports["_MY_REPORT"] = Array(
"ClassName" => "Myreport",
"Category" => "_CUSTOM_REPORTS",
"Options" => "daterangeField,limit"
);
Class Myreport extends Report{
function Settings() {
$this->columnDefinitions[] = array("Label" => _LOCATION);
$this->columnDefinitions[] = array("Label" => _USERS, "bchart" => true);
$this->help = "The description of this report goes here";
}
function DisplayCustomForm(){
$form = "
";
return $form;
}
function GetReportData(){
if(!empty($this->author)){
$this->addlabel = "My author: " . $this->author;
}
$import["NL"] = 45;
$import["FR"] = 0;
$import["EN"] = 86;
$i = 0;
foreach($import as $key => $val){
$data[$i][0] = $key;
$data[$i][1] = $val;
$i++;
}
return $data;
}
}