André, October 23, 2017

This article shows you how to setup Logaholic on Windows server 2012 R2 running IIS 8.5.

Before we start its important that your Windows Server 2012 R2 is up to date. It should have the latest updates and patches that Microsoft has released. Some of the required Microsoft components will fail to install if your server is not up to date.

When your server is setup right, has the latest updates and running as it should we advise you to use Microsoft Web Platform Installer http://www.microsoft.com/web/downloads/platform.aspx to setup Php and MySql. For this article we installed Php 5.6.31 and MySql 5.7.19 but you should be fine with the other versions as well that are listed with Microsoft Web Platform Installer 5.0.

Before you start we advise you to install Fast CGI, this is included in your Windows server however not installed by default.

So go to your Windows Explorer, select Computer from the top menu and then select uninstall or change a program. Next select turn Windows features on or off. Add Roles and Features Wizard starts up. Select in left pane Server Roles, under Roles open Webserver IIS, open Web Server, Open Application development and select CGI, click next and complete the wizard.

When done you should see a Fast Cgi icon appear in your IIS UI home pane when you select a site in the left pane of IIS UI.

Find some documentation here:
https://docs.microsoft.com/en-us/iis/configuration/system.webserver/fastcgi/#setup

Now go to http://www.microsoft.com/web/downloads/platform.aspx and install Microsoft Web Platform installer or run it if you already installed it before.

Search for Php, when you select Php 5.6 the installer will automatically select an additional 3 components please install all 4 by following on screen instructions. After the wizard is done you may want to check that PHP installed as expected.

To test your PHP installation

  1. Open a text editor on your server, for example Notepad, as Administrator.
  2. In a new file, type the following text:
  3. Save the file as C:\inetpub\wwwroot\Phpinfo.php.
  4. Open a browser on your server and enter the following URL: http://localhost/phpinfo.php

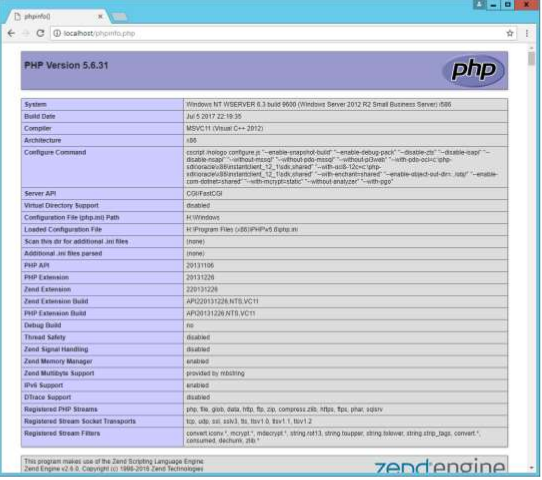
A webpage like below should load, showing current PHP settings.
Next open your Microsoft Web Platform installer again, search for MySql select and install it. We could have done this in 1 go with Php but I think its better to do this separate. Follow the on screen instructions when the MySql installer runs. MySql proposes to install Microsoft Visual Studio C+++ dependent on your platform 32/64bit this could be 3 ? 5 additional redistributables.

Click execute when MySql installer offers to find and install MsVs, obviously when MsVs is already installed on your server you can just click install. When MsVs is successfully installed click install and complete the MySql installation.

Reboot your Server.

When your server is back up again Open IIS in the left pane click your server. In the home pane under IIS you should see a Fast CGI settings icon. Double click this Icon. This should reveal the absolute path to your Php installation. See below picture. Remember this youll will need this later.
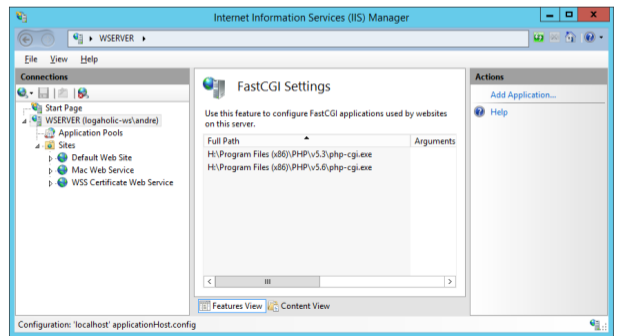
Fast CGI Settings in IIS 8.5 for Logaholic Web Analytics

Download Logaholic latest version www.logaholic.com/download. Un pack the downloaded file. You will find a folder called Logaholic. Copy the folder Logaholic and paste it in the root of your website in our case we followed the default installation layout of the Windows server 2012 R2.

Logaholic was pasted in the folder wwwroot C:\inetpub\wwwroot\logaholic\

Now open a browser on your server and go to http://localhost/Logaholic/install.php Logaholic’s installation procedure will load in your browser.

Please follow these instructions http://www.logaholic.com/manual/installation/set-up-wizard/

When you have submitted all requested data in the setup screen Logaholic will check if your php settings and folder permission are correctly set up. Most likely Logaholic will report on some php settings that have to be corrected. Locate the php.ini file in the PHP directory with highest version number, you had revealed the path earlier in the Fast Cgi component see above. Open php.ini in a text editor in administrator mode. Correct the reported settings. Find some more information here:
http://www.logaholic.com/manual/installation/php-settings/

Click Recheck in Logaholic’s installation wizard to see if the Php settings pass.

Most likely you will see in the Installation wizard that Logaholic reports it cannot write to the Folders Data, Files and Temp. This can be kind of a challenge to correct under IIS.

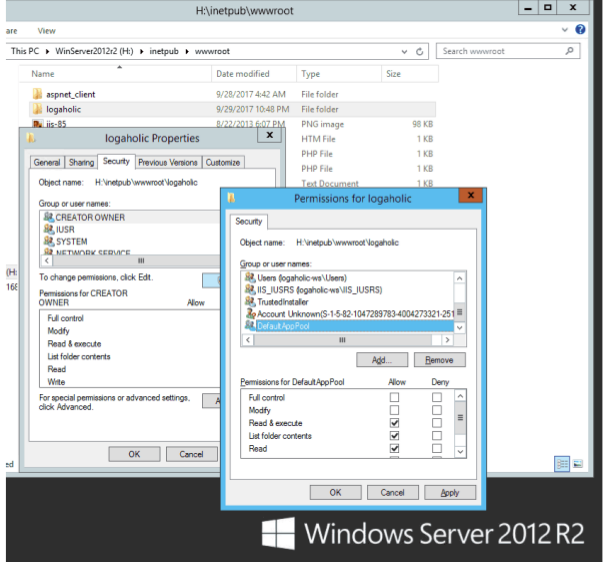
Applications that run under IIS require an account that has sufficient permissions. You wont be able to find this account for security reasons this account is hidden. The account name is derived from the website names and application pools that are running under IIS on your server. Our server still has default settings and names so the account we have to give sufficient permissions for writing to the folder Data, Files and Temp is called DefaultAppPool and is its a member of the IIS APPPOOL group.

To set the appropriate permission:
Select (in Windows Explorer) the properties of the Logaholic directory.
(C:\inetpub\wwwroot\logaholic\)

Choose the Security Tab, click Edit and then click Add.
Click locations, select server name and click ok. For “Enter the object names to select”, enter: IIS APPPOOL\DefaultAppPool
Then 3X ok.
(DefaultAppPool is the default account name, if your website has another name then default then use different name replace DefaultAppPool for different name)

Now set writing permissions for DefaultAppPool on the Logaholic folder.
Go to IIS UI Connections pane select Logaholic, double click Authentications Icon, edit Anonymous Authentication, set to Application Pool identity.

Now you should be able to complete the setup of Logaholic.
For more information see https://technet.microsoft.com/en-us/library/hh994613(v=ws.11).aspx

For security reasons remove earlier set writing permissions for account DefaultAppPool in the Logaholic directory, as follows:
Still assuming you are using the default setup locations of your Windows server, if not replace loactions and used account names accordingly.

Open Windows Explorer, go to C:\inetpub\wwwroot\logaholic\ right click the Logaholic folder, choose properties, choose the Security Tab, click Edit, Under user names/groups choose “DefaultAppPool”, under Permissions for DefaultAppPool un-tick “write” and save.
Next.
Go to C:\inetpub\wwwroot\logaholic\data\ right click the “data” folder, choose properties, choose the Security Tab, click Edit, Under user names/groups choose “DefaultAppPool”, under Permissions for DefaultAppPool tick “write” and save.
Next.
Go to C:\inetpub\wwwroot\logaholic\files\ right click the “files” folder, choose properties, choose the Security Tab, click Edit, Under user names/groups choose “DefaultAppPool”, under Permissions for DefaultAppPool tick “write” and save.

Next you can go ahead and configure necessary profiles in Logaholic for more information see: http://www.logaholic.com/manual/profile-configuration/

Logaholic enables you to track visitors through Web server log files and/or through the included java tracker. Should you decide to use your web server log files to track visitors you will have to allow “read” permissions to the above mentioned DefaultAppPool for the folder where your log files reside. By default IIS 8.5 on Windows server 2012 R2 stores logfiles in C:\inetpub\logs\LogFiles\W3SVC1\. Allow DefaultAppPool write permissions as followes:

Right click folder “W3SVC1”, choose properties, choose the Security Tab, click Edit, Under user names/groups choose “DefaultAppPool”, under Permissions for DefaultAppPool tick “read” and save.

You will find more information on the above mentioned tracking methods here.

author admin, September 18, 2017

Today we have a guest post by Gilad Maayan from the Web Analytics & BI Wiki:

In today’s fast-paced industry, companies face multiple challenges as they attempt to form a solid marketing strategy that meets business objectives. These challenges include managing marketing technology across the organization, difficulties in reaching prospects, driving customer engagement across a multitude of platforms, and tackling the complex world of web analytics.

Apparently, tackling analytics for your website is a challenge even for seasoned marketers. A recent survey by Think with Google uncovered specific challenges related to analytics technologies – namely, 61% of marketing decision makers struggled to access or integrate the data they needed in 2016.

Here are three types of web analytics challenges businesses are dealing with today and some ideas on how to solve them.

1. Too Many Metrics

In today’s industry, access to web metrics is the name of the game. But many marketing teams tend to go too far and become web analytics fanatics. Knowing which metrics to measure is important, but how do you make sure you’re measuring the right metrics? Or maybe you’re using too many metrics, without clear guidelines on what to do with the results?

According to Jay Baer of Convince & Convert, just because you can measure something, doesnt mean you should. Identify the metrics that are important to your business goals. Don’t measure all metrics obsessively, but identify the few metrics that do require closer attention, such as visitors and pageviews, conversion rates, top pages, and more.

2. Data Accuracy and Data Security Issues

Another challenge related to web analytics is that site performance data isn’t always accurate. Issues such as missing tracking code on web pages, data sampling with skewed results, ad block services that filter out valuable analytics data, and incorrect data filters are only a few examples of where you things can go wrong.

Beyond plain website analytics, mobile and web apps introduce additional complexities. Even if your mobile app analytics is spot on and you’re tracking the right metrics for your apps, this doesn’t ensure that you have full visibility of your users’ various data sessions.

Make sure that untracked or overly exposed data isn’t causing privacy or security vulnerabilities. Recent data privacy regulations are forcing US companies to put data privacy front and center, reviewing data security policies and ensuring better workflow management to prevent data breaches or even cyber attacks.

A solid network is key to protecting the systems running behind the scenes, those systems in charge of your users’ data. Define proper monitoring procedures, put security testing in place, and make sure to reach full application visibility to track performance at all levels and protect your system against application-level threats.

3. Insufficient Knowledge

In the survey mentioned above by Think with Google, 26% of marketers said they didn’t have the right analytics talent to meet marketing objectives, such as improving campaign effectiveness. They reported it was a struggle to get buy-in and support from executives.

Even if your organization has already established a suite of web analytics tools to provide meaningful insights into user behavior, you might be working hard to deal with the information overload. Add web analytics dashboards, customer experience tools, heatmaps, and BI analytics into the mix, and you’re sure to be overwhelmed.

One way to address this challenge is to use a reporting platform that simplifies the way you view your data (take a look at Logaholic, which does just that).

But even before you drill into a specific metric or technology, you might need to take a step back, widen your perspective, and improve your general understanding of the space of web analytics, BI, and big data.

This was one of the motivations the Web Analytics & BI Wiki built by CoolaData – makers of a big data behavioral analytics platform. The team at CoolaData took on a project to make the available content about web analytics and BI for digital marketing more accessible. The wiki is the first knowledge hub that collects all the relevant information on the subject and organizes it in a meaningful structure.

There are many additional resources that can help you get a better grasp on BI and big data concepts, for example, gurus such as Avinash Kaushik can guide you through some first steps in figuring out web analytics.

Closing Thoughts

Most organizations are convinced they lag behind their peer group when it comes to deploying and managing the performance of marketing technology. The CMO of a Fortune 100 company was embarrassed to admit that her team struggled to manage all of their technology. Believe me – we are all in the same boat.
Source: http://www.cmswire.com/digital-marketing/5-challenges-marketers-must-face-in-2017/

For many companies, the acquisition and implementation of new technology has gotten ahead of the logistics of tracking and managing data that is already in place. In this article, we discussed three common challenges businesses face when incorporating web analytics technologies and how to tackle them.

But there are many more. The fast-changing digital marketing industry introduces daily questions: How should we address big data? How do we support a multitude of platforms, especially IoT devices? Which marketing processes should we automate, and how to improve existing automation?

Don’t run from your challenges – identify them, and find strategies to solve them. With a balance between the right tools, solid professional expertise, and knowledge about the latest trends, you’re already on the right track to meeting your goals.

author admin, July 7, 2017

In web analytics, conversion rate is the percentage of users who take a desired action. These actions can include signing up for a service, downloading a file, subscribing to a newsletter, making a sale etc..

The conversion rate is one of the most useful website metrics in the web analytics toolkit because it’s a great way to measure the quality of your website traffic, your website content and your offer.

It is also a great basis for ad spending. Simply put, if you know it takes 100 visitors to make a $20 sale, you know you can’t pay more than 20 cents per visitor before you start to loose money.

However, often the conversion rate is calculated over all your traffic, in which case the results can be misleading.

If your site gets a total of 500 visitors a day and 10 visitors converted, your conversion rate is 10/500*100 = 2%. Simple right?

The problem with that is that not all traffic is created equal.

Different visitors have different motives and circumstances under which they visit your site. Some may have no interest in your offer to begin with, some may have landed on your site for whatever reason, without any intent to ever convert… they just don’t fit.

It might be nice to have them on your site, but these aren’t the people you are looking for when you set up Adwords ads or a Facebook campaign, or when you try to optimize a page’s conversion rate.

What we really want to know is: who are our customers? What does that traffic look like and how can we get more of that.

From our example above, let’s say all our paying customers come from the US, but over half of our website visitors come from other countries. In this case, it’s much more interesting to consider these separate groups when calculating our conversion rate.

In web analytics, segmentation refers to looking at parts of your data, rather than everything in total.

Knowing our customers come from certain countries is a great way to divide our visitors into more meaningful buckets, or “segments”.

In our example, even though our overall conversion rate may be just 2%, for the audience we actually care about the REAL conversion rate is double that, 4%.

That also means we can spend twice as much on advertising per visitor, provided we target the ads to the same type of visitor segment.

So, how do we find our customer segments?

This is where your web analytics tool comes in. You’ll need a tool that allows you to segment your traffic and run reports on just that group of visitors.

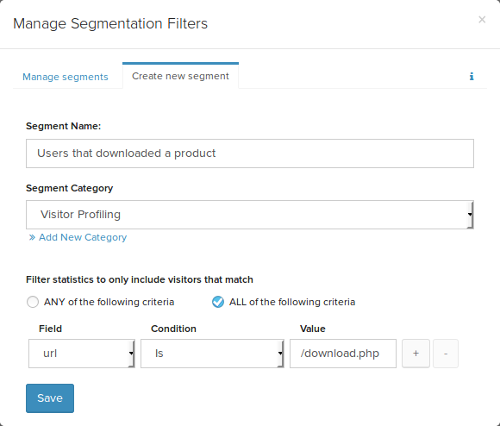
In Logaholic, you would create a segment based on one of your target actions, for example:

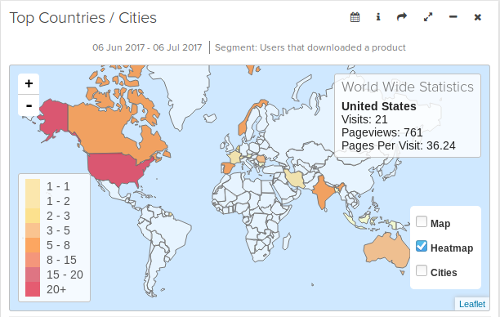
Then you can run that segment of reports like Top Countries, Top Referrers, Top keywords and so on to find out where these converted visitors are from and how they got to your web site.

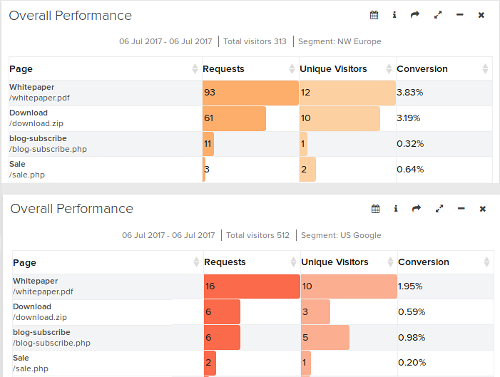
Using this information, you can create new segments that define your customers groups more closely. For example from US with referrer Google or Facebook kittens group…. whatever works for your traffic.

Once you’ve done that, its time to check your conversion rates again.

You now have multiple conversion rates for multiple desired actions across multiple visitor segments. This gives you a much better picture of what kind of visitor you are after and what they are worth.

Real conversion rate

Armed with this information, you’ll be able to target your ads in systems like Google Adwords, Facebook and others more accurately. That should also help bring your cost per visitor down.

Looking at your conversion rate through the lens of a segment will also allow you to spot differences in preferences between your segments. You can use this to tailor content on your website to certain groups, to increase your conversion rate even more.

author admin, June 30, 2017

Anyone with a website knows it’s important to have access to website metrics. You need to know how many visitors you are getting, where they are coming from and what they are doing on your site.

So I am sure you already have one of the many web analytics tools in place, even if it’s only Google Analytics.

But let’s be honest, how often do you really check your site metrics?

My guess is; not too often. In fact, our data suggests most people don’t view website traffic reports more than once a month.

The problem with that is that one day, even if you have the best analytics tools, you’ll open up your reports and be like this:

When you find out your website metrics are 0

Now, I’m not suggesting you dwell on all your site metrics every day, because for most of the numbers once a month is fine.

But there are a few you should be monitoring closely. These website metrics can reveal disaster or fortune. Left unchecked they can cost you dearly when traffic patterns suddenly change.

You don’t want to find out your traffic collapsed 3 weeks ago or that Google has banned your site! Likewise, it might be nice to know you made the front page of Reddit and there is smoke coming out of your server!

So here goes, my choice of essential website metrics to check each day:

1. Visitors and pageviews

This one should speak for its self. Monitoring the daily number of unique visitors and pageviews is an easy way to check if your site is performing as expected. Any large dips or spikes will be easy to spot and allow you to investigate further.

2. Conversion rates

Visitors and pageviews tell you something about the quantity of your website traffic. Your conversion rates will tell you something about the quality of that traffic.

Of course you shouldn’t just measure conversion to your sales confirmation page. You should also measure it for things like newsletter sign ups, contact forms and key pages involved in your customer’s journey.

So make sure you have your conversion tracking set up. Its called Goal Url’s in Google Analytics, Logaholic calls it Key Performance Indicators.

If you haven’t done so already, set it up now! Because you will want to know if your website traffic is converting the way it should on a daily basis.

3. Top Pages

Make sure to include a top 10 or top 20 pages report in your daily review. You want to keep tabs on what the most popular content on your site is. If one of your pages suddenly gets a lot of traffic, you want to catch that in time so you can make any changes or improvements to that page while it’s hot.

4. Top Referrers

Like pages, you want to know where your traffic is coming from so you can respond when needed.

5. Bounce Rate

A “Bounced visitor” is a user that accessed only one page on your site and then left. In general, large changes to your daily bounce rate mean something fishy is going on and it’s time to take action.

Other website metrics

These 5 site metrics are available in most web analytics tools, but there are many more website metrics. You can find a list of web analytics definitions here.

Get your daily dose automatically

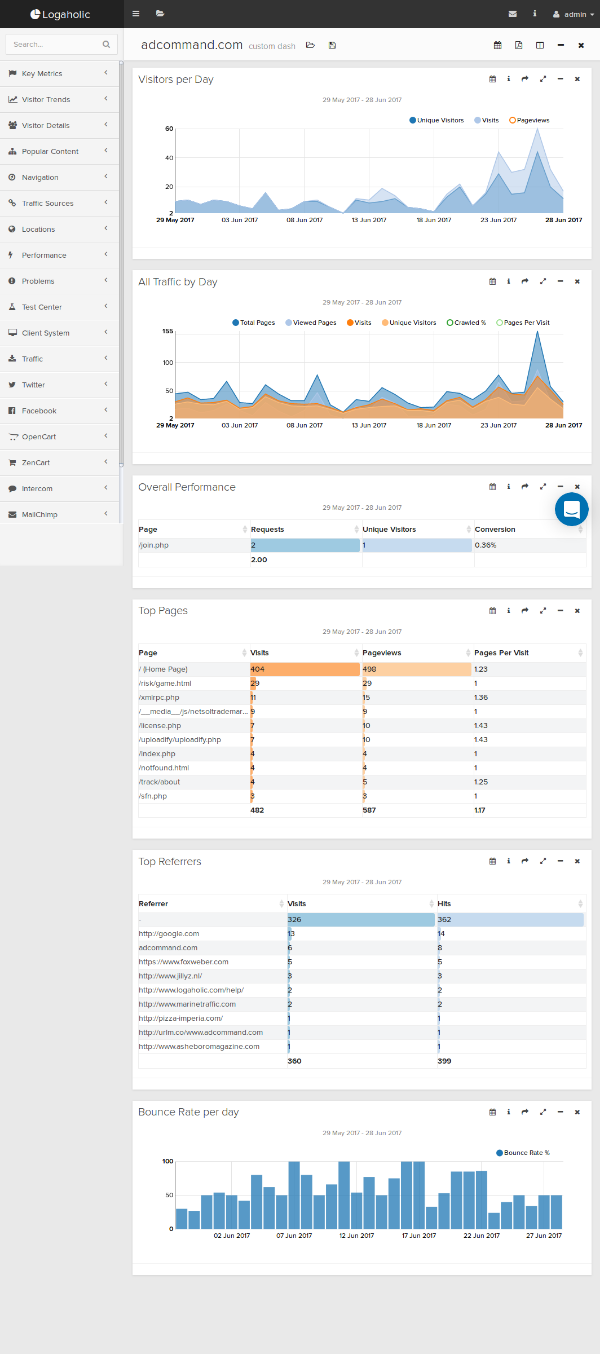
Logaholic makes it very easy to organize these reports in a dashboard so you can always access your website metrics quickly.

Also, Logaholic allows you to set up daily emails with your own choice of reports. You won’t even have to go log in to your reporting system, they automatically land in your inbox every day.

5 website metrics

author admin, February 10, 2017

We’re happy to announce the release of Logaholic 6.0.9. This version features lots of improvements and some powerful new features.
 

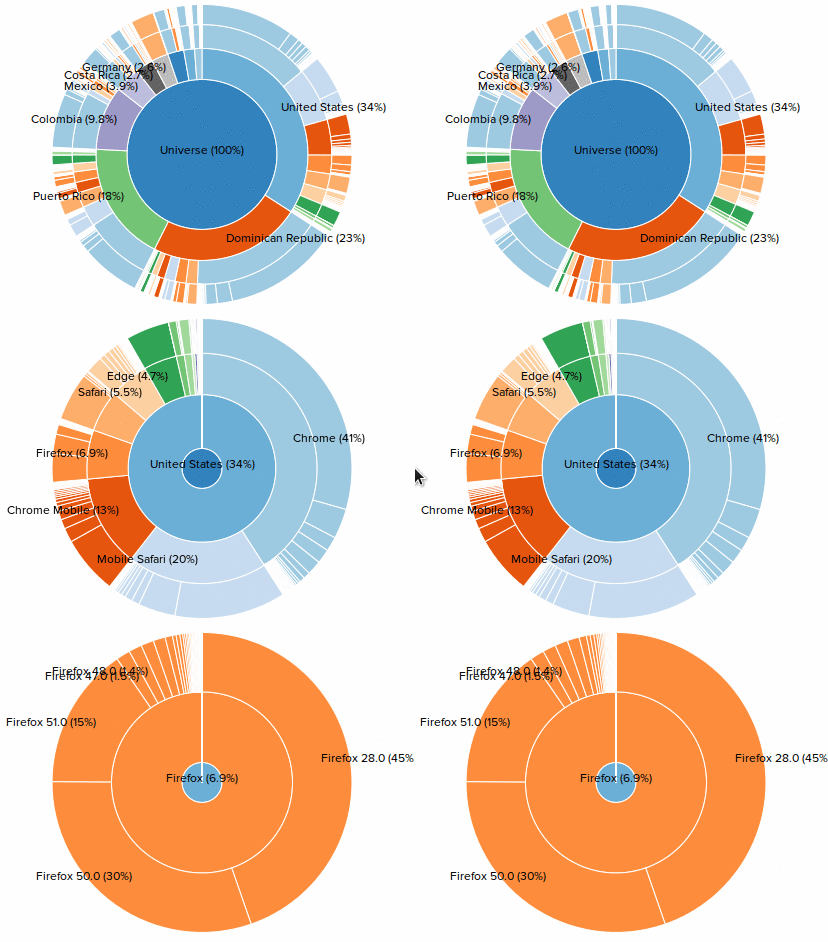
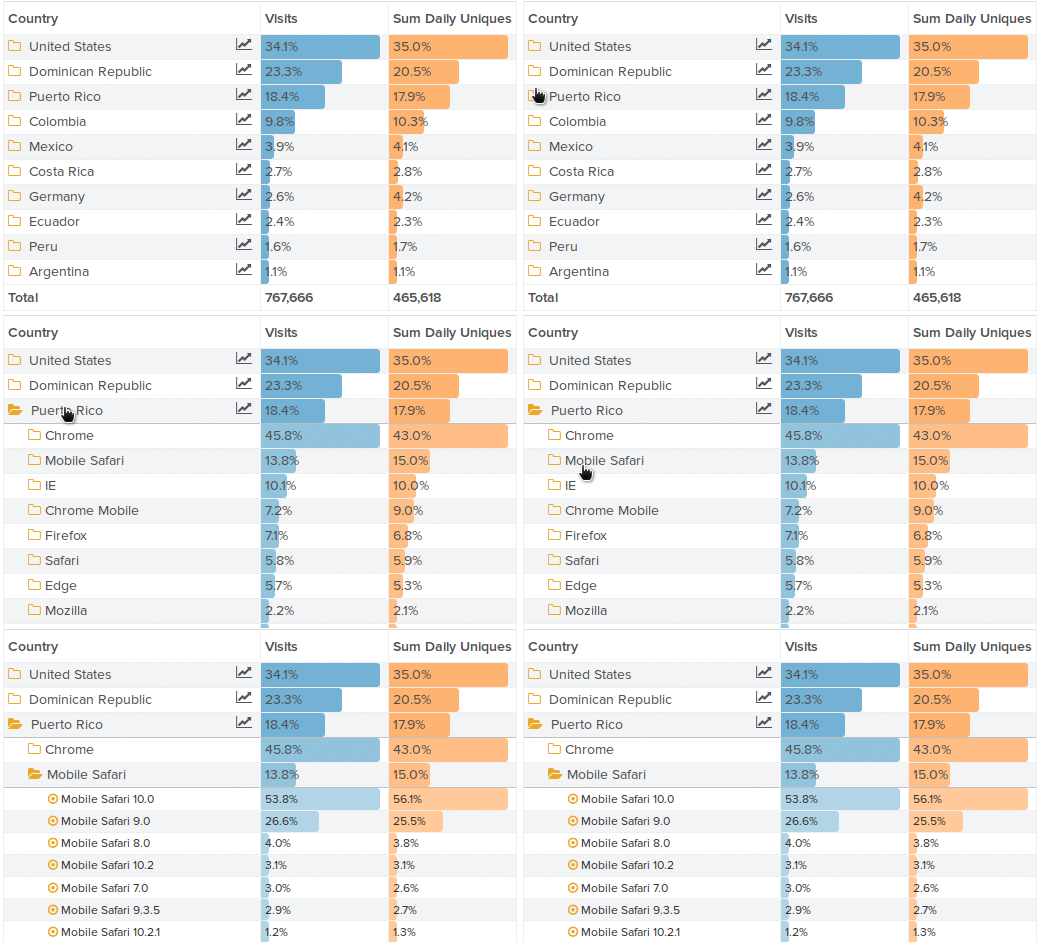
New insights in browsers and operating systems by country

The new Logaholic reports called Browsers by Country and OS by Country provide a powerful breakdown of browser and OS preferences in two great new visualizations:

Sunburst Visualization:

Peek 2017-02-09 22-56

Drilldown Visualization:

Peek 2017-02-09 23-09


Social Media break down and Trends

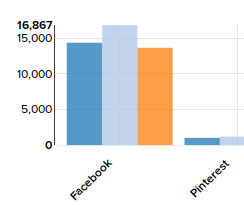
This report breaks down your analytics by social media platform, find out how many visitors you are getting from all major sites, like Facebook, Linkedin, Youtube, Instagram and many more, including international platforms like Weibo and vKontakte.
social media analytics
 

Desktop or Mobile?

Mobile internet usage is going though the roof, but that impacts some sites and web apps much more than others. So it’s time to know: How much of your traffic is mobile?

desktopvmob
 

More trends

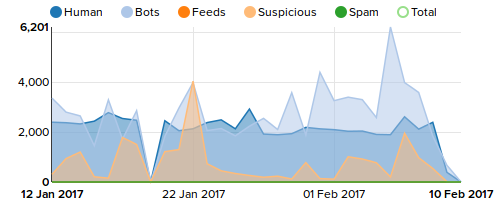
A new Visitors per Year report lets you easily compare your traffic from year to year. The OS Trends report give you a high level view of changing OS usage. The All Traffic by Type report gives a birds eye view of how Logaholic has classified your traffic.

trafficbytype
 

Power features for serious analysts

We’ve added some features that might not be at the top of the list for everyday users, but our power users have told us they need it – so we built it!

Private Dashboards:

If you are sharing profiles and dashboards with your clients, it’s sometimes nice to have a private dashboard that only you can see.

Global and Private Segments:

Logaholic’s segmentation filters are great for slicing and dicing your data into cohorts that are more valuable when analyzed separately. If you have a lot of profiles, you can now make global segments that are instantly available in all your profiles. Or, you can make the segment private, so only you can see it.

Custom cookie tracking and user identification:

Imagine being able to identify your visitors by email or username across all your web analytics reports. Custom cookie tracking now makes it possible to use any cookie your site or web app might use to identify a visitor and pass that to logaholic as the main visitor ID.

Dashboard layout options:

It now possible to change the number of columns in your dashboard – from 2 up to 6 columns (some people must have really big screens)!
 

Improvements

This version also has improved translations – so you can enjoy your stats in German just as much as in English.

Data export options like CSV and JSON have been improved and enabled on more reports. Your data – use it however you want.

On screen tutorials have been improved to get you up and running with Logaholic in no time.

Logaholic 6.0.9 is now available on our Saas platform or as download.