author admin, May 4, 2018

There are about a million things you could do to improve your website to gain and convert more visitors. These things are different for each website. But there is one simple, objective thing that you can do on any website that will please your visitors, improve your conversion rate and improve your search engine rankings.

Do you want to know what it is? You guessed it, it’s page speed. In other words, page load time; the time it takes for a page to completely load in a visitor’s browser.

How important is page speed?

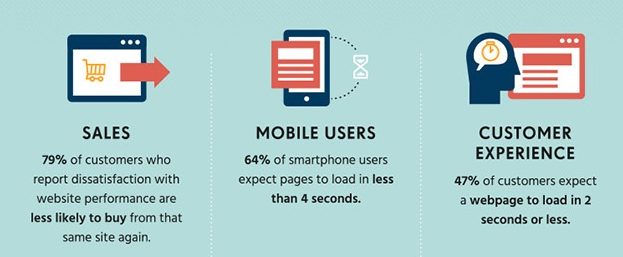
Research has shown that page speed has a massive impact on how long your visitors stay on your website, how many pages they read and how well they convert.

A study by Google showed that 53% of people will leave a mobile page if it takes longer than 3 seconds to load. Other research suggests that a delay in load time of just one second can leave you with a 7% reduction in conversions.

Check out the full infographic at the bottom of this post for more information.

Nobody likes a slow website, and this is especially true for mobile users. What’s more, Google takes page load time into account when ranking your website in the search engine.

So it’s clear that improving your website speed is a win win situation no matter how you look at it.

How to measure your website speed?

Measuring website speed can be difficult because the time it takes for your pages to load can differ widely between visitors.

If your website is hosted in New York and your visitor is from China, they will experience a different page load time than a visitor from a closer location.

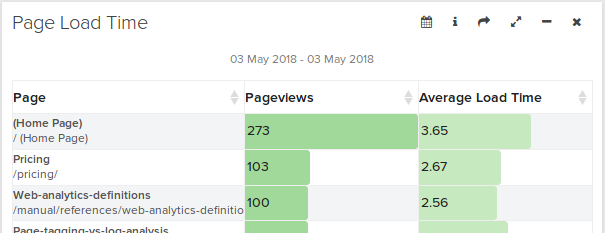
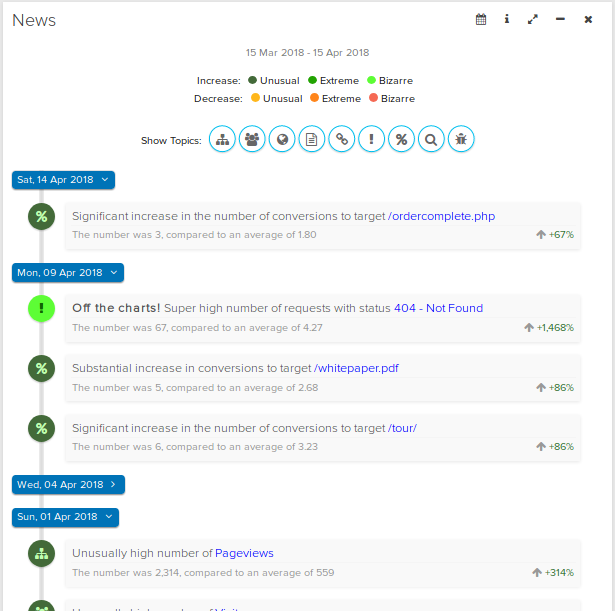
Logaholic’s new Page Load Time report measures your website speed for any visitor from any location whenever it can.

This gives you a representative sample of your average page speed for each and every page on your website across your entire audience.

Of course you can use Logaholic’s segmentation filters to view your page load times per country, per device or per marketing segment.

How to improve page speed?

So now that we have an idea of how long it’s taking our visitors to load up our pages, it’s time to see how we can improve those page load times.

Luckily there are some great online tools that can help us do this. The free Pingdom website speed test tool is a good place to start. Also, Google’s Page Speed Insights offers a great way to analyse your page speed and guides you through all the steps needed to improve your page load times.

There are many things you can do, like minify your JavaScript and CSS files, optimise your images, enable compression on your web server and many more.

Simply applying the tips these tools have to offer, will allow you to greatly reduce your page load time.

It might be a little work to implement all the optimisations but take a look at the infographic below and you’ll see why is worth the effort.


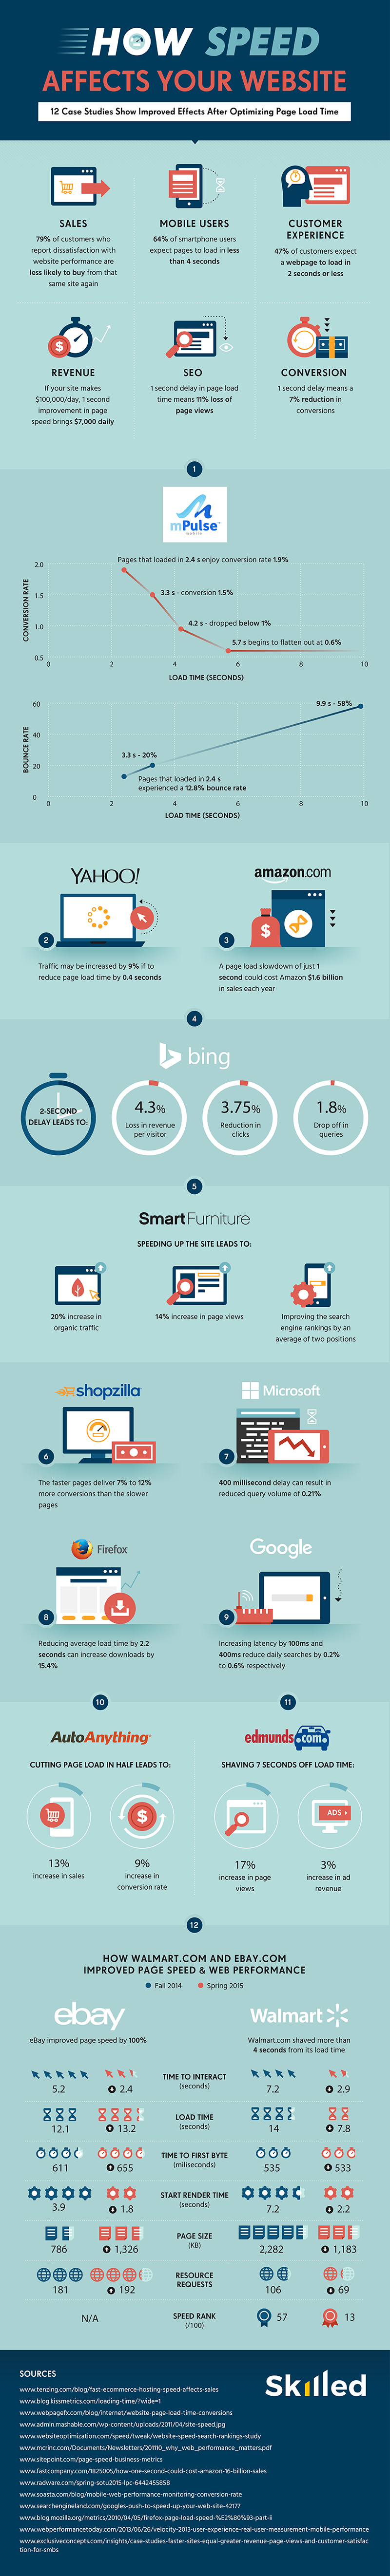
Infographic bySkilled.co

author admin, May 1, 2018

Last week we introduced Logaholic 7.1, which adds a feature than can automatically analyze Web Analytics trends. We call it the News report. Since we’re pretty excited about this feature, let’s go ahead and take a closer look.


Source: xkcd

What’s the problem?

The problem with checking your Web Analytics regularly is that it often takes a lot of time because there is so much information.

Rather than just looking at a bunch of numbers on a screen you want to try to find meaning in the data. Why are my visitor numbers going up or down? Is my traffic from Google converting into customers? Where did that sudden spike in pageviews come from?

To answer these questions we need to closely look at multiple reports, charts and graphs, which can be time consuming.

The premise of the News report is that it will analyze the trends in your data for you, so you don’t have to spend any time on that.

The News report will show you a text digest, highlighting any noteworthy events in your data. To do this the News report looks at a number of Web Analytics trends. These are:

  • Visitors and pageviews
  • Country trends
  • Page trends
  • Referrer trends
  • Error trends
  • Conversion trends
  • Keyword trends
  • Bot/Crawler trends

The report identifies any significant events by calculating the standard score (also called Z-Score). For weekdays, the average used to evaluate an observation are based on all weekdays within the selected date range. Saturdays and Sundays use separate averages for each day.

In statistics, the standard score is the signed number of standard deviations by which the value of an observation or data point is above the mean value of what is being observed or measured.

https://en.wikipedia.org/wiki/Standard_score

The report will allow you to choose a default z-score, which will determine how sensitive it is to changes in your data. This will result in an increase or decrease the number of news items you see in the report.

Let’s take a look at an example below:

Notice the news items are categorized by topic, and color coded to reflect the rise or decrease observed.

The topic of any news item can be clicked to pull up a context menu which will allow you to investigate the issue further. The menu will give you quick access to different reports in the software like trends, conversion rates or anything else that is relevant to the context of the news item.

This makes the News report the ideal starting point for investigating your traffic. It will give you an instant overview of the most important events that occurred in your data since the last time you looked and provide you with a targeted entry point for deeper analysis.

The News report is available in Logaholic 7.1 and were happy to announce that it’s in the free version so everyone can use it out of the box.

author admin, April 26, 2018

We’re happy to announce the immediate release of Logaholic version 7.1. This version adds a range of new reports and features.

Introducing the News report

Everybody loves a good chart. A line chart is a great for spotting changes and trends, but there are a lot of charts to cover. Sometimes you just don’t have the time.

That’s where the Logaholic News Report comes in. It analyzes all the trends for you and singles out events that are noteworthy. That way you have an instant overview of any important changes or events in your data.

Any news item can be clicked to bring up a context menu that will allow you to investigate further. It’s the perfect starting point for a quick dive into your stats!

Introducing UTM reports

In this version we’ve added full support for UTM parameters. We’ve included a UTM breakdown report and separate reports for all 5 parameters so you can view your traffic by source, campaign, medium, term and content.

Any UTM parameter can be easily turned into a Logaholic segmentation filter for further analysis in other reports.

New javascript tracking tag

We’ve also updated our tracking code. It now collects more data and has even less impact on browsing speed. If you are currently using our tracking tag, it’s important to update the code in your pages when you upgrade to Logaholic 7.1. Of course, it’s also backward compatible with older versions of the tag.

The new data allowed us to add these new reports:

  • Ad Blockers; shows you what percentage of visitors are using an Ad blocker
  • Page Load Time; show you the average time it took for your website’s pages to load in the browser
  • Time on Page; shows you how long visitors spend on any particular page.
  • Page Scroll Depth: shows you how far your visitors scrolled down a page.

You can combine our new javascript tracking tag with analyzing your log files. That way you get the benefits from both data collection methods.

Adwords traffic verification

We’ve also added 2 reports to help you verify the traffic you may be getting from Google Adwords campaigns.

Adwords Clicks per Day shows you how many unique visitors clicked, how many clicks per user and how many of those might be bots.

Adwords Clicks per User shows you the Adwords traffic on a user level, down to the actual IP number.

This information has already helped several Logaholic users get refunds from Google on some of their ad expenditure.

Logaholic 7.1 is now available on our site, please enjoy and let us know what you think!

author admin, April 19, 2018

Logaholic Web Analytics will support the use of UTM url parameters in it’s next release, Logaholic 7.1.

What are UTM parameters?

UTM parameters are a way of tracking your advertising and marketing efforts. The idea is to “tag” incoming links with the information you need to measure your marketing performance.

There are 5 variants used by marketers to track campaigns across traffic sources and publishing media. Wikipedia breaks them down as follows:

ParameterPurposeExamples
utm_source (required)Identifies which site sent the traffic, and is a required parameter.utm_source=Google
utm_mediumIdentifies what type of link was used, such as cost per click or email.utm_medium=cpc
utm_campaignIdentifies a specific product promotion or strategic campaign.utm_campaign=spring_sale
utm_termIdentifies search terms.utm_term=running+shoes
utm_contentIdentifies what specifically was clicked to bring the user to the site, such as a banner ad or a text link. It is often used for A/B testing and content-targeted ads.utm_content=logolink or utm_content=textlink

Here is an example of a link that uses UTM parameters:

http://www.logaholic.com/?utm_source=facebook&utm_medium=cpc&utm_camp=Logaholic71

This link would allow us to identify the traffic source (Facebook), the ad payment type (CPC, cost per click) and the name we’ve given this campaign.

Using this information we can segment our traffic into discrete groups, so we can measure the conversion rates for each one.

Urchin Tracking Module parameters (or UTM) were first introduced by Urchin. Urchin later became Google Analytics. As a result, UTM parameters have become widely used.

If you’ve used UTM parameters in the past and have the log files for your website, you can now use Logaholic to analyze all your previous and current campaign data.

Logaholic 7.1 will be available early next week, so stay tuned.

author admin, January 2, 2018

By “Fake”, I mean that this traffic it is not generated by humans, but by a myriad of scripts, bots and other automated processes. Some are well intentioned, but most are not. These busy little bees scan for vulnerabilities on your site, wordpress login pages, test scripts and a 1001 other things.

If you only use javascript tags to collect data about your website visitors (i.e. like Google Analytics), you have absolutely no idea that this is going on. You have no idea that so much of your bandwidth and server resources are being consumed by agents that are trying to damage you.

The only way to find out what all these creepy crawlers are up to is to analyze your website’s log file. However, the results can be overwhelming compared to tag based data collection.

Ignorance is bliss

Bots usually don’t read javascript files, which means they do not show up in javascript based solutions like Google Analytics. As a result, the numbers you see mostly represent real humans. This is a nice side effect, because for marketing purposes we are usually only interested in humans.

If you’re analyzing log files, this becomes more difficult. You have a lot more information, but how to see which visitors are real and which ones are not?

As the number of malicious bots has skyrocketed over the last year, log file based analytics have diverged more and more from the javascript based numbers.

Until now, log file based analytics has mostly relied on bot detection via the information in the user agent. This catches most of the “legitimate bots” which are left out of most reports by default.

Evil bots however try to pose as real users so these usually slip through the cracks, inflating the number of visitors compared to a javascript tracker.

Best of both worlds

To solve this problem, Logaholic 7 now features “Behavior Based” bot detection. This classifies all clients as a “bot”, unless it behaves like a human. For example, when the client requests both html and images or javascript during a visit.

In terms of bot detection, you’re now guilty until proven innocent, not the other way around.

Most reports in Logaholic display only “human” data by default, but can be switched to “all traffic” to see what the creepy crawlers are up to.

This way you have useful reports from the marketing perspective, but also from the security and IT perspective.

All new Logaholic profiles using log files will be automatically set to Behavior Based detection. Existing profiles can be switched manually – but prepare for a massive drop in visitors … and don’t shoot the messenger 🙂

Get Logaholic 7 now!