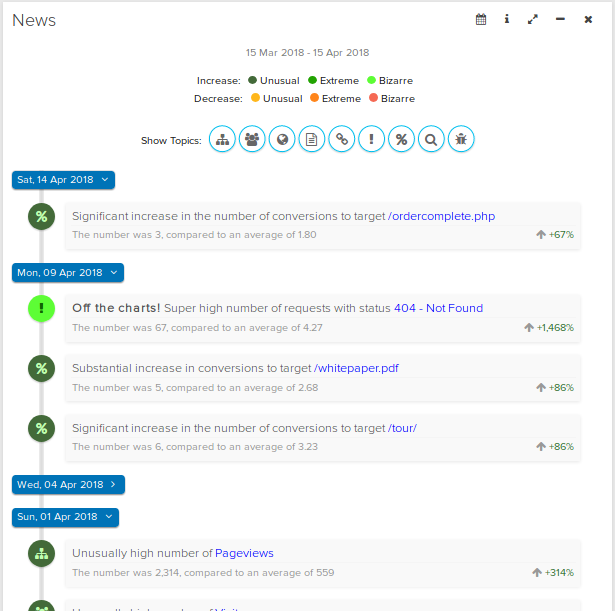
author admin, May 9, 2018

A page view can only tell you so much. Have you ever wondered how long a visitor stays on the page or how far they scrolled down? Maybe they didn’t even see your beautiful download button. So we want to see if visitors are engaging with your content.

By website engagement we mean the ability to hold the attention of a visitor or to get the visitor to participate in some sort of activity.

Scroll Depth

The first metric we can take a look at is scroll depth. Here is a screenshot from the logaholic report.

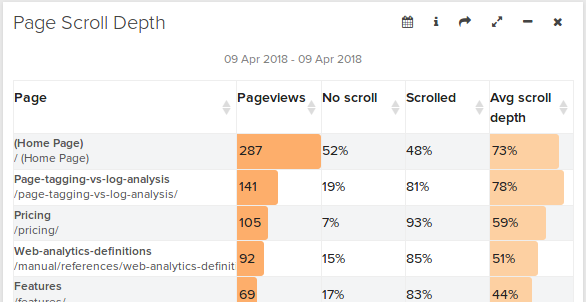
This report shows how far your visitors scroll down a page. Scroll depth represents the percentage of the page a visitor has seen. For example, if the average scroll depth is 50%, that means that on average your visitors scroll far enough to have seen half of the content of the page.

This report will show you that a lot of people don’t scroll at all and that those who do rarely make it all the way down.

Armed with this information take a look at the content on the page and make sure your most important elements are visible within the average scroll depth. It’s always a good idea to make sure that important call to actions appear above the fold, so even if the visitor doesn’t scroll he’ll still have seen the most essential elements of the page.

If you have a long page that requires a lot of scrolling, you can use the average scroll depth metric as an indicator of how long your copy is holding the attention of your visitor. You can experiment with how your content is presented to try to increase the average scroll depth.

Time on Page

Time on page is another important metric we can use to estimate visitor engagement. Let’s take a look at a screenshot:

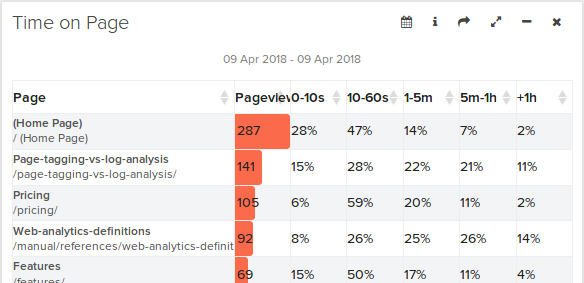
This report shows how long visitors stayed on a certain page. It’s divided up into groups, because using one general average here wouldn’t be a very helpful representation of how long different user stay on your pages.

Combining this data with the results from the scroll depth report should give you a pretty good idea of which pages are doing a good or bad job in communicating your content to your visitors.

Page Analysis

The page analysis report is another report you can use to determine whether visitors on a page are continuing to another page on your website. If they are you can at least assume your content was interesting enough for them to want to find out more.

Page conversion

This will give you an idea of how effective a landing page is at converting visitors to one of your key performance indicators.

Website Engagement

All these reports are available with Logaholic Pro. Use these reports together to get a comprehensive view of the visitor’s engagement with your content.

author admin, May 4, 2018

There are about a million things you could do to improve your website to gain and convert more visitors. These things are different for each website. But there is one simple, objective thing that you can do on any website that will please your visitors, improve your conversion rate and improve your search engine rankings.

Do you want to know what it is? You guessed it, it’s page speed. In other words, page load time; the time it takes for a page to completely load in a visitor’s browser.

How important is page speed?

Research has shown that page speed has a massive impact on how long your visitors stay on your website, how many pages they read and how well they convert.

A study by Google showed that 53% of people will leave a mobile page if it takes longer than 3 seconds to load. Other research suggests that a delay in load time of just one second can leave you with a 7% reduction in conversions.

Check out the full infographic at the bottom of this post for more information.

Nobody likes a slow website, and this is especially true for mobile users. What’s more, Google takes page load time into account when ranking your website in the search engine.

So it’s clear that improving your website speed is a win win situation no matter how you look at it.

How to measure your website speed?

Measuring website speed can be difficult because the time it takes for your pages to load can differ widely between visitors.

If your website is hosted in New York and your visitor is from China, they will experience a different page load time than a visitor from a closer location.

Logaholic’s new Page Load Time report measures your website speed for any visitor from any location whenever it can.

This gives you a representative sample of your average page speed for each and every page on your website across your entire audience.

Of course you can use Logaholic’s segmentation filters to view your page load times per country, per device or per marketing segment.

How to improve page speed?

So now that we have an idea of how long it’s taking our visitors to load up our pages, it’s time to see how we can improve those page load times.

Luckily there are some great online tools that can help us do this. The free Pingdom website speed test tool is a good place to start. Also, Google’s Page Speed Insights offers a great way to analyse your page speed and guides you through all the steps needed to improve your page load times.

There are many things you can do, like minify your JavaScript and CSS files, optimise your images, enable compression on your web server and many more.

Simply applying the tips these tools have to offer, will allow you to greatly reduce your page load time.

It might be a little work to implement all the optimisations but take a look at the infographic below and you’ll see why is worth the effort.


Infographic bySkilled.co

author admin, May 1, 2018

Last week we introduced Logaholic 7.1, which adds a feature than can automatically analyze Web Analytics trends. We call it the News report. Since we’re pretty excited about this feature, let’s go ahead and take a closer look.


Source: xkcd

What’s the problem?

The problem with checking your Web Analytics regularly is that it often takes a lot of time because there is so much information.

Rather than just looking at a bunch of numbers on a screen you want to try to find meaning in the data. Why are my visitor numbers going up or down? Is my traffic from Google converting into customers? Where did that sudden spike in pageviews come from?

To answer these questions we need to closely look at multiple reports, charts and graphs, which can be time consuming.

The premise of the News report is that it will analyze the trends in your data for you, so you don’t have to spend any time on that.

The News report will show you a text digest, highlighting any noteworthy events in your data. To do this the News report looks at a number of Web Analytics trends. These are:

  • Visitors and pageviews
  • Country trends
  • Page trends
  • Referrer trends
  • Error trends
  • Conversion trends
  • Keyword trends
  • Bot/Crawler trends

The report identifies any significant events by calculating the standard score (also called Z-Score). For weekdays, the average used to evaluate an observation are based on all weekdays within the selected date range. Saturdays and Sundays use separate averages for each day.

In statistics, the standard score is the signed number of standard deviations by which the value of an observation or data point is above the mean value of what is being observed or measured.

https://en.wikipedia.org/wiki/Standard_score

The report will allow you to choose a default z-score, which will determine how sensitive it is to changes in your data. This will result in an increase or decrease the number of news items you see in the report.

Let’s take a look at an example below:

Notice the news items are categorized by topic, and color coded to reflect the rise or decrease observed.

The topic of any news item can be clicked to pull up a context menu which will allow you to investigate the issue further. The menu will give you quick access to different reports in the software like trends, conversion rates or anything else that is relevant to the context of the news item.

This makes the News report the ideal starting point for investigating your traffic. It will give you an instant overview of the most important events that occurred in your data since the last time you looked and provide you with a targeted entry point for deeper analysis.

The News report is available in Logaholic 7.1 and were happy to announce that it’s in the free version so everyone can use it out of the box.

author admin, June 30, 2017

Anyone with a website knows it’s important to have access to website metrics. You need to know how many visitors you are getting, where they are coming from and what they are doing on your site.

So I am sure you already have one of the many web analytics tools in place, even if it’s only Google Analytics.

But let’s be honest, how often do you really check your site metrics?

My guess is; not too often. In fact, our data suggests most people don’t view website traffic reports more than once a month.

The problem with that is that one day, even if you have the best analytics tools, you’ll open up your reports and be like this:

When you find out your website metrics are 0

Now, I’m not suggesting you dwell on all your site metrics every day, because for most of the numbers once a month is fine.

But there are a few you should be monitoring closely. These website metrics can reveal disaster or fortune. Left unchecked they can cost you dearly when traffic patterns suddenly change.

You don’t want to find out your traffic collapsed 3 weeks ago or that Google has banned your site! Likewise, it might be nice to know you made the front page of Reddit and there is smoke coming out of your server!

So here goes, my choice of essential website metrics to check each day:

1. Visitors and pageviews

This one should speak for its self. Monitoring the daily number of unique visitors and pageviews is an easy way to check if your site is performing as expected. Any large dips or spikes will be easy to spot and allow you to investigate further.

2. Conversion rates

Visitors and pageviews tell you something about the quantity of your website traffic. Your conversion rates will tell you something about the quality of that traffic.

Of course you shouldn’t just measure conversion to your sales confirmation page. You should also measure it for things like newsletter sign ups, contact forms and key pages involved in your customer’s journey.

So make sure you have your conversion tracking set up. Its called Goal Url’s in Google Analytics, Logaholic calls it Key Performance Indicators.

If you haven’t done so already, set it up now! Because you will want to know if your website traffic is converting the way it should on a daily basis.

3. Top Pages

Make sure to include a top 10 or top 20 pages report in your daily review. You want to keep tabs on what the most popular content on your site is. If one of your pages suddenly gets a lot of traffic, you want to catch that in time so you can make any changes or improvements to that page while it’s hot.

4. Top Referrers

Like pages, you want to know where your traffic is coming from so you can respond when needed.

5. Bounce Rate

A “Bounced visitor” is a user that accessed only one page on your site and then left. In general, large changes to your daily bounce rate mean something fishy is going on and it’s time to take action.

Other website metrics

These 5 site metrics are available in most web analytics tools, but there are many more website metrics. You can find a list of web analytics definitions here.

Get your daily dose automatically

Logaholic makes it very easy to organize these reports in a dashboard so you can always access your website metrics quickly.

Also, Logaholic allows you to set up daily emails with your own choice of reports. You won’t even have to go log in to your reporting system, they automatically land in your inbox every day.

5 website metrics

author admin, February 10, 2017

We’re happy to announce the release of Logaholic 6.0.9. This version features lots of improvements and some powerful new features.
 

New insights in browsers and operating systems by country

The new Logaholic reports called Browsers by Country and OS by Country provide a powerful breakdown of browser and OS preferences in two great new visualizations:

Sunburst Visualization:

Peek 2017-02-09 22-56

Drilldown Visualization:

Peek 2017-02-09 23-09


Social Media break down and Trends

This report breaks down your analytics by social media platform, find out how many visitors you are getting from all major sites, like Facebook, Linkedin, Youtube, Instagram and many more, including international platforms like Weibo and vKontakte.
social media analytics
 

Desktop or Mobile?

Mobile internet usage is going though the roof, but that impacts some sites and web apps much more than others. So it’s time to know: How much of your traffic is mobile?

desktopvmob
 

More trends

A new Visitors per Year report lets you easily compare your traffic from year to year. The OS Trends report give you a high level view of changing OS usage. The All Traffic by Type report gives a birds eye view of how Logaholic has classified your traffic.

trafficbytype
 

Power features for serious analysts

We’ve added some features that might not be at the top of the list for everyday users, but our power users have told us they need it – so we built it!

Private Dashboards:

If you are sharing profiles and dashboards with your clients, it’s sometimes nice to have a private dashboard that only you can see.

Global and Private Segments:

Logaholic’s segmentation filters are great for slicing and dicing your data into cohorts that are more valuable when analyzed separately. If you have a lot of profiles, you can now make global segments that are instantly available in all your profiles. Or, you can make the segment private, so only you can see it.

Custom cookie tracking and user identification:

Imagine being able to identify your visitors by email or username across all your web analytics reports. Custom cookie tracking now makes it possible to use any cookie your site or web app might use to identify a visitor and pass that to logaholic as the main visitor ID.

Dashboard layout options:

It now possible to change the number of columns in your dashboard – from 2 up to 6 columns (some people must have really big screens)!
 

Improvements

This version also has improved translations – so you can enjoy your stats in German just as much as in English.

Data export options like CSV and JSON have been improved and enabled on more reports. Your data – use it however you want.

On screen tutorials have been improved to get you up and running with Logaholic in no time.

Logaholic 6.0.9 is now available on our Saas platform or as download.