silvia, January 26, 2010

Who are your visitors?

Dear web analytics learner, welcome back to the blog. In our last issue we rounded up the 3-step sequel of web analytics for beginners and now we are going to take a closer look at your business and your website’s visitors, and find out how Web Analytics can help you increase your ROI.

In Web Analytics, there are different ways in which you could define your visitors. In my last post I mentioned the segments you can make, which allows you to break down the incoming traffic to your site into manageable groups (segments) by geographic location or referrer.

Just to show you how easy it is to create a segment in Logaholic, I’ve created a little video for you here:

It’s useful to have segments for things like:

  • New Visitors
  • Customers
  • Traffic from important or paid links
  • Traffic from important geographic markets

After creating segments for groups of visitors, you’ll have much more insight into your visitors because segmented statistics are much more valuable than a site wide average. Remember the popular adage says: “The average human has one breast and one testicle”… So be careful not to make too many assumption based only on site wide averages.

Customer segmentation and ROI

Knowing who your visitors are comes down to figuring out what they are looking for when coming to your website. For example, creating a segment for visitors from www.shareware.com from USA, and naming it: USA Shareware.com traffic, will help you to find out if advertising on shareware.com pays off. The Overall performance report from the Conversion rates tab is a starting point for measuring your ROI of different segments. In this report, after you have created the above mentioned segment of visitors, you will see exactly how many of them converted and what the overall conversion rate is.

The Sales Funnel

Another great way to evaluate your ROI is by creating a sales funnel report. When setting up the sales funnel, you can insert the cost for a single click of incoming traffic (for example, from shareware.com) to your site and at the bottom, the revenue from a sale. When the sales funnel is generated, it will display the total number of visitors to your site from shareware.com and how much traffic trickles down through the different stages you have defined, what the conversion rate and bounce rate is from stage to stage and finally what the ROI of the funnel is, based on the cost per click and the revenue generated by the target page in last funnel stage.

How to increase ROI

Using the example above, let’s say the reports show that my traffic from shareware.com isn’t converting very well. This tells me that the money I spent on advertising on this site didn’t yield enough sales to justify the cost. A few of them downloaded a trial version of my software, but nobody bought it. Now, it could be that my software sucks, but it could also be that people coming from this site only look for free software. Now that I know it, at least I can slash my advertising on shareware.com and stop wasting money.

Another example: If I make a sales funnel for my Italian visitors from Google, lets say I find out that 5 % of them convert. Compared to a 2% conversation rate of my USA Google visitors. The sales funnel just helped me discover that if I can increase my visitors from Italy or if I create a landing page in Italian for them, I can probably get even more orders from them.

This is one of the many measures you can take to increase efficiency and ROI on any of your online campaign.
To (part 5)

silvia, December 15, 2009

“Where are my visitors coming from: all about referrers”

Dear Web Analytics starter, welcome back to my blog. This week we are going to answer the second most important question of any Web Analytics user: “Where are my visitors coming from?”

Assuming you have read my previous post and know what types of visitors are reported in your Web Analytics software (I am using Logaholic Self Hosted Edition 2.4.3 as an example), I will continue with introducing you to the sources of your traffic.

If you are actively advertising your site or optimizing it for organic search, you would expect to get visitors from:

  • Referrers (other websites where you are linked or where you advertise)
  • Search engines (Google, Yahoo, etc)
  • Directly from users who type in your URL in their browser or if they have bookmarked it

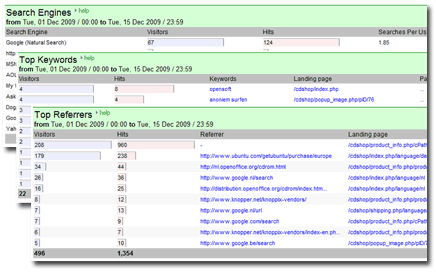
These traffic sources will be listed in more detail in the Top Referrers and Search engines reports in your Incoming Traffic tab (in Logaholic). A typical Top Referrers report will show you all traffic sources in one list, so if you want to look only at the performance of search engines, you would need to generate the Search Engines report. The Top Referrers report will only show you the sum of visitors and page views for each item. More detailed info is hidden in the URL of the referrer, so when you click on it, you can drill down deeper with tools like Click Trails, Trends and filters.

According to my Top Referrers report I get most of my site’s traffic from Google. In the report I can see the number of visitors each referring web page has generated for me. If I want to know where my visitors are from geographically, I can access the Top Countries and Cities reports. If I want to get more personal with my visitors and check pout activity on an individual basis, I can go to the Most active users report, where I will see the IP’s and corresponding country and city of each of my most active visitors. Clicking the IP number will also allow me to access the Click Trail for that user, so I can see the visitors’ complete history on my site.

One thing to note about referrer reports is that they provide little insight into direct traffic (bookmarked pages and people who type in your url). You can recognise them in the referrers list because instead of a URL of the referrer, there is a dash sign displayed. This is because your Web Analytics software cannot identify a URL as a source (for instance, the user may have received a direct link to your site in an email, or he might have typed it in, or bookmarked it in his browser).

Down to the bottom line

As you see, your Web Analytics program will generate various reports to show you where your traffic comes from in as much detail as you like. However, at the end of the day it all comes down to these ‘bottom-line’ type of questions: (eg) Are your Italian visitors buying more than the German ones and is your Google paid search yielding more visitors to your site who make a purchase (or become contributors, subscribers, etc).

Sometimes, the default reports might not give you the exact answer you are looking for. This is where Segmentation comes in. In Web Analytics, segments are groups of visitors defined by certain characteristics (parameters). In Logaholic this is called a Segmentation filter. For example you could make a filter that creates a group of visitors that match the following criteria: visitors from Germany that come from Google typing the keyword: “solar power”. You might then name this segment ‘German solar power visitors’ (you can use any name you want). Next you could create a another segmentation filter, with the same settings but now from Italy. A Segmentation filter can be applied to most reports in Logaholic which means you now have the ability to easily compare visitor segments to each other.

Separating the wheat from the chaff

But why would you need to know so much about your incoming traffic? The answer is in the Conversion reports. As you are spending money on Google Ads, or time optimizing your site for a better search engine position, you want to know if your efforts generate any profit. The Referrer and Keyword conversion reports will show you the truth about your business at one glance: you will see which referrer has generated visitors and how many of them have converted.

In order to see which referrers bring you visitors who convert and from which countries come most of the converted visitors, you would need to create those segments I mentioned above. In the course of time, you will be able to track the performance of certain referrers and at some point you will see that some of them generate more valuable traffic than others. Hence, you will stop advertising there on the less performing sites. Or you might discover certain trends in your traffic from a certain country and update your site’s content in their language or send them an email. If most of your converted visitors are from a foreign country, you might decide to do more advertising on partner sites in their language. The possibilities are virtually endless. With keywords, segmentation is also crucial: you can save a lot on dropping many useless keywords that don’t generate conversions and increase traffic for those who do.

The hidden agenda of this post was to show you that the essence of your Web Analytics software is not to show you charts and numbers, but to help answer practical questions about your business. But no matter how smart, your web analytics software is just a tool, you still have to dig for the gold yourself. Hopefully, you now know some techniques that will help you get more from your tools, and closer to the gold in your data. With this post I am officially ending the beginner’s part of our Web Analytics blog sequel, which will continue next week with a focus on ROI and conversion, and the more advanced analytic tools used to track them.

Please feel free to leave you comments or questions below!

To (part 4)

silvia, December 1, 2009

“How many visitors are coming to my site?”

Dear Web Analytics beginner,

Welcome to my second post. Just to refresh your mind, last week I started an online diary of my first Web Analytics experience using the Self Hosted Edition of Logaholic Web Analytics. In my previous post I talked about targets and key performance indicators, the basic underpinning of any e-marketing strategy, and the first step in getting meaningful Web Analytics for your site.

This week I’m going to talk about incoming traffic to your site and how this is reflected in the reports in your Web Analytics software.

The truth is out there

Let’s start on the Logaholic Dashboard, the “Today Overview”. In this overview report you’ll see references to Visitors per day and per month, per page, per keyword and so on. It’s important to remember that the dashboard overview is just a summary of the statistics that are gathered in other reports. With some Web Analytics solutions, such as Logaholic, the dashboard is customizable, which means that depending on your interests, you would place different reports on it. The most typical information is usually displayed on the dashboard, and that might seem like all the info you need, but in fact it’s just the tip of the iceberg.

But first of all, you need to ask yourself a simple question: “How many visitors are coming to my site?” In order for us to be able to answer this question, we need to define what visitors are.

The Web Analytics Association defines a Unique Visitor as:

The number of inferred individual people (filtered for spiders and robots), within a designated reporting time frame, with activity consisting of one or more visits to a site. Each individual is counted only once in the unique visitor measure for the reporting period.

As most of you know, we all try to attract human visitors to our site: people who are interested in our product or service and whom we are trying to convert to customers. So what is all this talk about robots ?

Humans vs Spiders and Robots

Your Web Analytics software does not see all ‘users’ as ‘visitors’; by which we mean real people as defined above. There are also software programs, called “crawlers” or “bots” or “spiders” which are used by, for example, the search engines to crawl (scan) the pages of websites and index them to ensure they show up in relevant search results. GoogleBot is an example of such a crawler. There are also less noble crawlers, like the ones that are harvesting email addresses or are otherwise up to no good, but that is a different topic. In any case, the crawlers play quite an important role for your site’s visibility and SEO. However, they are less relevant to your bottom line: you can only sell to humans, not robots. So when looking at your visitor count, you would want crawlers to be excluded from most reports.

If you are interested specifically in crawler activity, you might want to look at the “Most active crawlers” report from the Incoming traffic section. Other reports to check out are the “All Traffic” reports, which shows how much of your traffic is being generated by both humans and crawlers. All other reports in Logaholic where the term “visitors” is used exclude crawlers and show only counts of human visitors.

Counting the beans

Now that we’ve figured out how your Web Analytics program defines a visitor on your site it would be a good idea to find out how it does the counting.

Which brings us to the real icky bit. There are basically three industry standard methods that can be used to count visitors.

  • By the visitors IP address
  • By a combination of visitor IP address and user agent
  • By Cookies

All of these methods have their own drawbacks and none of them are really very accurate. So, if you thought Web Analytics was an exact science, think again. It’s just an approximation of reality and it’s a good idea to always keep that in mind when you are working with Web Analytics reports.

In short; IP numbers are inaccurate because multiple people can share the same IP address (via a proxy), which causes the number of visitors to potentially be under-reported. On the other hand, many web users get a new IP address each time they log on to the internet, so this can cause the visitors to be over-reported.

Cookies on the other hand do not change when the user goes offline, so it is potentially a better method of counting, but users can refuse to accept cookies, or they can delete them. This means they will get a new cookie often. Also, cookies are browser specific, so one person visiting with two different browsers will be counted as two visitors. All this causes over-reporting.

The combination of IP address and user agent (a string that contains information about the users browser type) is often used when Cookies are not available. It is more accurate than just IP address in that it will minimize the proxy/IP sharing effect. But other than that it suffers from the same over-reporting effects as IP numbers and like cookies, it is browser specific.

In Logaholic, you can choose which counting method you want to use on the Advanced tab of the Edit profile screen.

Cookies are usually the default if you are using javascript tags to collect data. If you are using log files, you’ll probably want to use IP address or IP/Useragent unless you have a tracking cookie that is being included in the log file.

Don’t forget the time.

Finally, we have time to consider. When we say Unique Visitors we are referring to a unique count of some identifier within a date range.

So, if there are 100 unique visitors in one day, and 50 unique visitors the next day, but 10 people visited on both days, the total number of unique visitors for this 2 day period is 140 unique visitors, not 150.

Now you know

So, now that you know a bit more about the number of visitors to your site, we will look at traffic sources and keywords next week, which will be a nice wrap up to our beginner’s level, before we continue to explore the more advanced features of your Web Analytics software.

Meanwhile, if you have any questions or comments, please leave them below!

To (part 3)

silvia, November 24, 2009

Getting started with Logaholic Web Analytics

Hello! My name is Silvia Todorova and I am a Web Analytics beginner. I recently joined Logaholic as a marketing assistant and sooner or later it was time to start my acquaintance with web stats and analytics. In this blog I am going to take you through the first 7 weeks of my exciting adventure into the world of Web Analytics 🙂

After my first week in the realm of Web Analytics, I can say I am progressing with the speed of a toddler: every day there is something new to get my hands on, which makes my movements more stable and secures me another step to my goal.

The idea behind these posts are to keep a record of my first steps in Web Analytics so I can help other beginners with using such software. However, this is not a user manual: that has already been made and you can find it here. The purpose of my future posts is to help people like you learn from a few practical stories that highlight the essence of any Web Analytics software that you are considering to buy or are already using.

What is the Self Hosted Edition

If you are using a self-hosted edition of Web Analytics software it means that you are “hosting” or have access to your site’s data on the domain server. You could be using the log files on your server to track the site’s traffic or enable javascript tracking, which both entail that you would be able to update the traffic reports at any time and have access to real-time data. However, the point of Web Analytics is to know how to use this data to answer some important questions about your business and improve your website’s performance. The next 6 posts will be dedicated to answering that question.

What Web Analytics is all about

Web Analytics is more than just a bunch of statistical reports. The most important thing is that you need to know your website well and know what you want to achieve with it; what is the goal of your website ? Is it sales? Is it sign-ups, leads, downloads, comments? Every website should have goals.  Withour goals you can’t measure your Return on Investment or determine if your website is successful.

Tip: You need to think of at least one clear thing your website is supposed to accomplish for you, and keep that in mind when you look at your web analytics data.

Just like any other business, the business of e-marketing is about targets, and so is Web Analytics. You measure the performance of your site in terms of different targets: will enough people come to the site, will enough see the catalogue, how many of them will buy a product, how many will return, and etc.

So the cornerstone of your Web Analytics will be the targets, or “key performance indicators” (KPI’s). In web anlytics, this term often refers to different target files on your website. A file that denotes a certain action taking place on your site is a target file. A target file indicates one of your goals has been reached. Examples of such files can be the checkout page displayed after purchase online, the confirmation of a newsletter subscription or an email inquiry confirmation.

The point of using Web Analytics is to measure how people entering your site (visitors) convert to (become) buyers, subscribers, readers, contributors, etc. If you are using Logaholic for your own business or to build reports for a commercial site, you will always need to justify the costs and investments made into driving traffic to your site. The way to do that is by measuring the conversion of your site, or in other words, how many visitors turn into buyers or subscribers. In order to be able to measure the conversion, you need to select the files that denote such a transformation from visitor to buyer ( for instance).

I am going to give you some examples here of target files for a typical e-commerce site:

If your site is called: www.e-books.com, some target files might look like this:

www.e-books.com/newsletter_thanks.html ( this is the Thank You page visitors see when they have subscribed for your newsletter).

www.e-books.com/shop/checkout_success.php ( is the Checkout notification after a purchase from your e-shop).

www.e-books.com/catalogue/russian/warandpeace.zip ( if you have downloadable files)

I hope these examples show clearly what a target file is. Of course there are thousands of other files that can be defined as target files, depending on what you are trying to achieve with your site.

After you “tell” Logaholic that these files are your KPIs ( in the profile configuration field, see the manual for more information), it will build reports based on the KPIs you selected. You will measure conversion against these pages and if you ever have a new page for sales or subscriptions on your site that you want to add as a KPI you will simply have to edit this site’s account in Logaholic by adding the URL of this page to the profile settings.

With this practical explanation of KPI’s and their configuration in your Web Analytics software I am thinking of ending this post. Next week when I have enough traffic for reports I will continue with the introduction of the reporting options in Logaholic and some exciting features of the programme. KPIs in detail will also be a topic of a more comprehensive discussion since there is so much about them that I haven’t learned yet. This week was just a whiff over the surface of the deep sea of analytics…:-)

Hope this post was useful to you so you will be back for more next week!

(To part 2)

michael, October 30, 2008

What if you want to try something completely different ?

What if you want to go beyond single page split testing and test an entirely new website, with new content, sales copy, a different design, the works ?

If you combine the power of Logaholic Web Analytics and a content management system like WordPress, there is a pretty easy way to pull off this magic trick.

If fact, if you are reading this, you are one of my test subjects and you are looking at the new website 🙂 I can now run both websites simultaneously and I’m sending 30% of visitors to my new site, and 70% to the old one as a control group.

Using the Logaholic Split Testing system I can track users to each website version and compare the results. Is the new website better at converting more visitors to trial downloads, subscribers and customers ?

You know the old saying ‘Don’t throw away your old shoes before you have new ones’ (is that a saying in your language?) is very true here. By testing your new site before you destroy your old one, you can be sure you are making the right decision and you have the opportunity to fix any problems without too much ‘damage’.

Step by Step Instructions

  1. Make a copy your wordpress database

    For your new website, I’ll assume you will use your current site as the starting point. Before we can change the content and settings of the new site, we need to make a copy of the wordpress mysql database, so our original site can stay unchanged.

    There are a number of ways you can make a copy of a mysql database, please read this if you are not sure how to do this. In my case, I could just copy the database folder like so:

    > cp -r /var/lib/mysql/wordpress /var/lib/mysql/wordpress_copy
    > chown -R mysql:mysql /var/lib/mysql/wordpress_copy

  2. Create a Split Test in Logaholic

    Open your Logaholic, go to “Test Center” and click “Create a new PHP split test”. Enter a name and description, something like “Website Split”, “This will split test the entire website”.

    Leave the “Import Test URL” field blank and click “Create”. Next, leave the variation fields completely blank, just click “Create” again.

    Now, click the link to save your test file. The file will be named something like this:

    profilename-splittest10.php

    Once published, this file will set a cookie for your visitors with a value of A or B, so we know if we want send them to website A or website B (the new one).

    The cookie variable will be named like this:

    $lgprofilename10

  3. “profilename” will be replaced with the actual name of your logaholic profile and
    “10” will be replaced with the split test ID number, please keep that in mind.

  4. Edit wp-config.php

    Make a backup copy of your wp-config.php file (located in your wordpress directory). Next, open it in your favourite editor. At the top you find a line that looks like this:

    // ** MySQL settings ** //
    define(‘DB_NAME’, ‘wordpress’); // The name of the database

    We are going to replace this with this:

    // ** MySQL settings ** //
    if (@$lgprofilename10!=B) {
    define(‘DB_NAME’, ‘wordpress’); // The name of the old database
    } else {
    define(‘DB_NAME’, ‘wordpress_copy’); // The name of the new database
    }

    This piece of code will load the new database for any user that has a cookie value of “B”, and the old site for anyone else (cookie=A or no cookie at all).

    Save the wp-config.php file and upload it to your server.

    To preview your new site, just open it in your browser and add ?lgprofilename10=B to the url.

  5. Build new website

    To build the new site, you’ll have to set the cookie permanently, so you can log into your wordpress administration area using the new database.

    To do this, create a new file called “manualcookie.php” (or whatever you want to call it) and put this code in there:

    <?php
    if ($cookie==”off”) {
    SetCookie(“lgprofilename10″,””,time() + 8640000,”/”,$HTTP_HOST,0);
    } else {
    SetCookie(“lgprofilename10″,”B”,time() + 8640000,”/”,$HTTP_HOST,0);}
    ?>

    Save the file, upload it to your server and open it in your web browser. Now you’ll be the only person in the world that will see site B when you visit your site.

    You can now log into wp-admin and make your new website.

    If you need to see your old site, you can always open a different browser (like firefox) or you can remove the cookie again by opening manualcookie.php?cookie=off

  6. Add Split Test Code
    When you are finished creating your new website and ready to start testing, copy the logaholic split test file (profilename-splittest10.php) to your wordpress directory.

    Next, open index.php (the one in your wordpress directory) and add this line to the top of the file:

    include(‘./profilename-splittest10.php’);

    Once you save the file, your visitors will automatically get the cookie and be directed to either your old or you new site.

  7. Evaluate Results
    Now, some visitors will start seeing your new website. Open your Logaholic, click Test Center and Click the ‘Website Split’ link to view the Split Test result report.

    Use different KPI’s / target files to evaluate how well each site converts to your most important files, the Split test report will tell you which site is the Winner !

  8. Go live with confidence
    Once you have your results. Just edit wp-config.php again, so it always loads your winning website database.

Pretty cool right ? Please leave your comments below, thanks!