michael, August 8, 2012

No matter how good your website is, without visitors it is a dead duck.

Not every visitor is equal and they are coming in from lots of different places.
This is not something static.

When your traffic patterns change, this could cause a positive or negative effect on your site’s conversion rate.
That’s why it is of paramount importance that you have insight into your traffic patterns over time.

In Logaholic it is very easy to see how your site is performing today – at this moment, as a whole, on average.

What’s even more interesting though, is the change that took place over a past period.

This is where the Logaholic Trend reports come into play.

These reports are designed to give you an intuitive view over a certain time period, revealing tell-tale changes in the past and pointing to the direction it is headed in the future. You will not only find them for visitor details, but also for statistics on pages, referrers, keywords, conversions, etc.

What makes them so important?

Without it you could find yourself on a wild goose chase. The more tools you have to quickly determine the cause of changes in your website’s performance, the easier it will be to fix or take advantage of these changes.

Most web analytics solutions will give you static summary reports. Not Logaholic, we give you the full replay over time.

Go ahead, give it a try!

Regards,
The Logaholic Team

michael, August 9, 2011

We’re happy to announce the beta release of Logaholic Social Stats, a free Facebook application that you can use to get insightful analytics on your Facebook friends.

It’s completely free and fun to use, so make sure to check it out now on http://apps.facebook.com/logaholic/

Logaholic Social Stats Facebook app

This app is part of our efforts to bring full features analytics for your Facebook friends, pages and apps to Logaholic. So stay tuned for more announcements soon!

silvia, April 6, 2010

What more are you missing?

Dear reader,

This post is about all the things about web analytics and your website that I missed to mention in my last six posts. Things like visit duration on site, bounce rates and the exciting Trends feature in Logaholic.

Visit duration and bounce rate

Why is it important to know how long your visitors stayed on the site? Here are a few reasons:

  1. Bounce rate indicates how compelling your content is

  2. Time on page has to be sufficient to lead to conversions

  3. Are you getting the right visitors to your site?

  4. Are your landing pages relevant to your visitors?

Bounce rate is defined as the ”percentage of visitors on your site who only visit one page, as well as the percentage who stay on one page for 5 seconds or less”.

In Logaholic, bounce rate can be found in the Top Exit Pages report in the Popular content tab. Here you can generate a report of the pages on your site where the most visitors left. On first sight, the Top Exit Pages seems like a compilation of all the pages on your site, but this shouldn’t surprise you: people HAVE to leave your site from somewhere. It would be only worth the worries if suddenly an important page such as the Shipping address form page lands in your top Exit Pages report. This would indicate that there is something wrong happening there, since once people are on this page, they are generally not supposed to exit your site from there.

Bouncing stats

Visit duration is a tricky term in web analytics because of the way it is measured: a visit has a starting and ending point, which is a moment when one page was loaded and when the subsequent one was loaded. If someone is browsing your website, your web analytics software logs the time that the page has been requested, and as soon as another page is requested, it logs a new time, so the difference between those would be the time on a certain page. However, what happens when a visitor closes the browser, goes to grab a snack, or leaves your site to go to Google or another site? In that case the visit duration of the last browsed page can never be calculated, and if the user visited only one page and left immediately, this variable becomes irrelevant. This is why in Logaholic you can generate a report for the (average) length of the visits on your site, but remember that this refers to pages browsed within a session. For people visiting only one page at a time (your home page or the landing page), Bounce rate is the value to look out for.
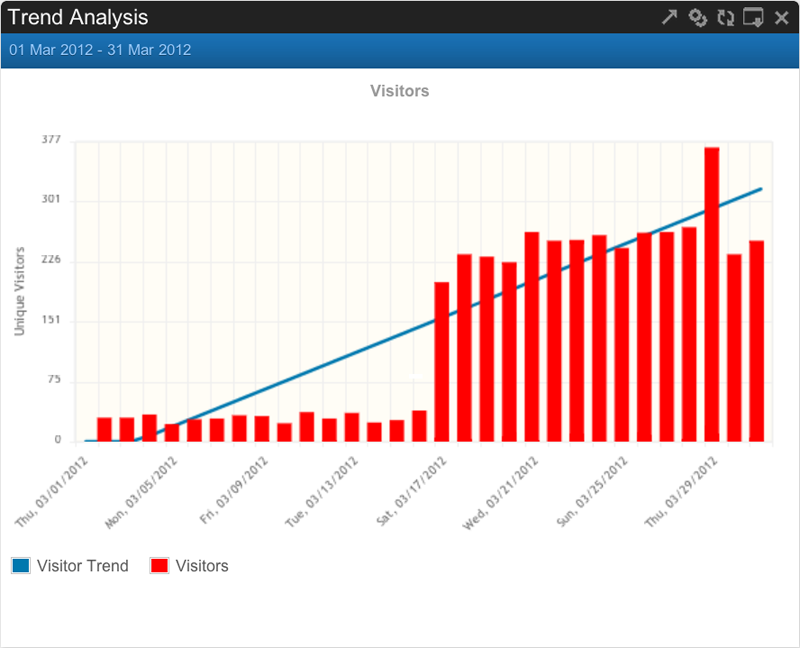
Comparing trends

Measuring trends for your website is crucial for your business because there is no other tool in web analytics that can really show how external factors are influencing your performance.

Comparing trends gives you an overall idea of how well/bad your business is performing and it is actually useful because it helps you answer questions such as: Why is the traffic to my site increased over the last 5 months?

Generally, you would use a trends report to compare how your overall conversion rates from this year are compared to the ones from last year. This will give you a yes and no answer: Yes, I am doing a lot better: 5% increase in conversions, or No, I am actually losing visitors, last year I had 8 % more visitors. However, how do you know if the trend is reliable? Maybe last year you had more visitors because you advertised more and maybe this year your conversion is better because you optimized your website? So in order to really be able to compare performance in the long run, you need to know what factors influence it.

Variables and trends

Before looking at the Trends report it’s important to be aware of the different factors that influence your site’s performance. This could be a new advertising campaign you started, a server crash, adding a page or changing the layout of your site, being excluded from a directory or dropping a referrer. These all are called ”events” in Logaholic. There are also external events such as the crisis in the industry in which you are operating: this would slow down your sales. So in order to be able to really draw conclusions when you compare trends, you need to have these variables in mind.

In every decent Web Analytics program there is a certain way to integrate these variables in your trends report. In Logaholic this is included in the “Notes” tool. This tool enables you to save each “event” with a name and a date so that, when looking at a trend report later and you see a significant peak or a drop of performance, you can refer it to the particular event.

Segments and trends

Comparing trends between segments is just as important as looking out for the events. Let’s take for instance the trend report Visitors. By comparing the Visitor trends of 2007 and 2008 you have established that you have 10% more visitors this year. You know that at the beginning of 2008 you started working with a certain affiliate. (event). Still, in order to find out why your overall count visitors have increased, you need to find out which visitors exactly have become more compared to last year. Maybe your organic traffic has increased? Or maybe it was this affiliate website that drew more traffic to your site? Or maybe it was something else?

In order to answer these questions you need to go back to your Incoming traffic reports, apply the particular segments and generate a separate report for 2007 and 2008 to see what changed there. These reports will show you what really happened. Maybe your organic traffic decreased, but the traffic from the affiliate doubled? So now you know he’s worth the commission you’re paying him. Or maybe it was your organic traffic that grew and contributed to the overall increase. But you can only find that out by digging into each individual referrer report. The Trends overview gives you a good starting point by showing you what to look for.

You can do the same for all kinds of Trends reports: Referer, Search engines, Conversion, etc. The important thing is to remember to look beyond the trend line before you make any conclusions.

Good luck!

This is the last post of my sequel. I hope that with it I leave you more educated, independent and motivated to roll up your sleeves and start optimizing your website. Of course, at the moment you are reading this, Logaholic is being updated and a ton of new features are being added, and so is any other piece of software on the market. But the hidden agenda of this post sequel was to show you that web analytics is not so much of a money investment than a tool that bridges the gap between your business goals and your online marketing endeavors. As you saw, even the most expensive web analytics solution will be useless if you don’t know your site, your goals, your visitors, your referrers, and so on. For some of you web analytics is a challenging pursuit, for others an exciting hobby, but no one can deny that it is one of the few ”sciences” that has a direct impact on the success of your business.

To (part 1)

silvia,

What do you want your visitors to do on your website?

Split testing and web page optimization

Hello to all of you, web analytics aficionados, who made it through the first five lessons of Learning Web Analytics and are still thirsty for more insights from my Logaholic Self Hosted Edition diary.

This diary revolves around the five W’s of Web Analytics and over the past five weeks I answered the Who, Where and What questions of your web analytics software, by using Logaholic as a point of reference.

Last week’s question was: What are your visitors doing on your website and (hopefully) from my post you learned which Logaholic reports help you answer it. However, since from the very beginning of this diary I am preaching “actionable analytics” I will fail to walk my talk If I don’t explain you how to take advantage of certain tools in Logaholic which will help you get your site visitors do what you want them to do. Hence the title of this post 😉

In my previous post you learned how to discover your ‘golden paths” by using the Road to Sales report. Here I will explain you how you can test one page against another to discover which one brings more conversions.

Split test it

This is one of the many reasons to start exploiting the useful Test Centre tool in Logaholic. Here you can set up a URL or a PHP split test. In a URL split test you choose a certain target file and compare the conversion rates of two pages that lead to it.

The output of the URL split test will depend on the difference in the page conversions. If Logaholic finds the difference to be significant, you will have a “winner” page: A or B. If there is too little difference in the page conversion rates the test will be “Inconclusive”.

And optimize it…

In the case of a winner, the next step will be to make the winner page more prominent to your visitors. There are different ways to improve the visibility of this page in terms of design: thicker letters on the link, another picture, change the position of the link, etc. You want to take full advantage of the fact that this page is important to your visitors and sways their decision to the positive when considering whether to buy your product.

bit by bit...

For those of you, whom Logaholic disappointed with an “Inconclusive” result of the URL split test, the fun just begins. My advice is to find a way to optimize both the pages you are comparing, so that their visibility to your visitors increases. I know, this requires a lot of work but in the end you will reap the fruits of your labour. Here’s the simplest way to do it:

  • Focus on each page separately and see how you can optimize its visibility. Take one of the pages and see what changes you can make to it to make it more prominent, then run a PHP split test to see which version yields more  conversions. (for info on PHP split testing see the manual and the video on our website).
  • Do the same for the other page, and then URL split test again with the target file.

…until you get there!

This testing exercise will put you back on the road to sales. It simply means that you will do yourself a big favor by navigating your customers better to the target files on your site and increasing your page conversions.

To (part 7)

silvia, March 30, 2010

What are your visitors doing?

Hello again, dear Web Analytics user!

Assuming you have already mastered the basics of reporting in Web Analytics, it is about time you learned to apply your analytical skills for finding out what your visitors are doing on your website, or as I like calling it: visitor surveillance. If “conversion” is the ultimate objective of your site, the behavior of your visitors on it is one of the cornerstones of your strategy. If I may use the example of a shoe shop from my previous post: it is not just a matter of getting people to your shop, but offering them the right amount of quality content in the right form that will turn your “window shoppers” into customers.

This brings us to three main pillars of your website: content, design and navigation (usability). If one of them is unstable, the overall conversion of your site will suffer.

Why is visitor surveillance needed?

You need to closely keep track of your visitor’s behavior if you want to find more ways to increase your conversion rates. In Logaholic, there are a few ways to find out where visitors click on, where they go to and where you would rather have them go…

Top Click Paths

A click path is a common string of pages many of your visitors clicked through on your site until they left it.

An example: People came to my site, changed the language to German and went on to look for products in the catalog.

/cdshop/index.php/language/de/ -> /cdshop/product_info.php/products_id/97 -> /cdshop/index.php/language/de/

In your Top Click Paths report you will find the most common ways people moved through your site.

Click Trails

With the Click Trails tool you can get Logaholic to provide you with an overview of the exact click paths for each individual visitor on your website. Although you should not make any broad conclusions based on the click history of individual visitors, they are very helpful if you want to get a sense of what real people do on your site, rather than aggregated numbers.

Road to Sales

This report is called like that for a reason. Here your target files (KPI’s) play a key role. You need to select a target file first and then generate the report. What you will see is literally “The Road to Sales”: which pages your customers visited before they converted (accessed your target file). The “Top Pages as Percentage of Converted Users” is an especially interesting part of this report: it shows you which pages were “involved” in the conversion process. If you know the content of your site well (meaning, you are not looking at statistics of other person’s website) the Top pages as of Converted users report can be a real gold mine for you.

Top page

An example:

Let’s say you sell shoes on your site and your target file is the order page. This means that the Top Pages as of converted users report will usually contain the pages in the catalog, or the pages where customers fill in credit card information, because these are the pages immediately before the order page. However, one day you decide to place a video advertisement of your latest collection on your site, and a couple of weeks later you open the Top Pages as of converted users report. Surprise! A new top page is now listed in it: the page with the video. This means that quite a few people who ordered shoes from your site saw the advertisement before that. Your video page has become the top page in the Road to Sales report! So now that you know that this particular content has positive effect on the conversion process, you can make sure that more of your visitors get to see it, by making it more prominent or easier to find. Also, you might be inspired to create even more content like to further increase your conversion rates.

Click through rate

A key feature in any Web Analytics program is to see how your website’s design/layout facilitates (or complicates) your user’s experience. With the Page Analysis tool you can select any page on your site and see how  many visitors got to this page and how many clicked through  to another page afterwards, or the so called CTR (click through rate of the page). This is a valuable tool, which you can use to gain a better insight into the navigation of your site and how easily visitors can find  your target files.

By selecting the Visual Mode your browser will show you the page as seen by your visitors, with Click Through Rate percentages displayed next to each clickable item on the page. Visual mode makes it easy to actually see where visitors click on your page and helps you find flaws in your design that can ‘misguide’ visitors. Subsequently, you can adjust your content so that your visitors are looking at the places you want them to look.

Internal site search

While most marketers focus their time and efforts on SEO (search engine optimization), or so called external search, too few pay attention to the gold mine that is the internal search engine (the search function on your website, if you have one). It is often assumed that once you have lured your visitors to your site, they can easily find all they want there. A lot of marketers place that empty Search field on their sites and hope that very few people would need use it. However, according to recent data by Google, 10% of the average website’s traffic is going straight to the Internal search field. So what does that mean for you? Internal search engines are becoming an important way of navigating your website, and you are probably ignoring that!

Fortunately there is an Internal Site search report in Logaholic, which enables you to find the most used search terms used by your visitors. This report is a great starting point for optimizing your internal site search. Be sure to run the Internal Site Search report on a weekly basis and check if the keywords used yield relevant results. A way to do this is by launching the Internal Site Search report, left-clicking the link that one internal search generated and from there launch the Page Analysis report. In the Visual mode you will see what percentage of the people clicked on which search results. If more people click on the Next button, it could mean you didn’t provide them with the right answers on the first page. But, the Internal site search report does even more than that. It shows you what visitors were really looking for, rather than just what they clicked on. It shows you the real intent of the user and that can be a great help in making your site even better.

I will end this post with the hope that you learned about some useful Logaholic tools to observe the behavior of your visitors. I can even recommend you an optimal “click path” in Logaholic Self Hosted Edition for visitor surveillance: Top click paths/The road to sales/Page analysis/Click Trails/Internal site search.;-)

To (part 6)