Last week Logaholic 4.0 Beta was launched and it’s already a great succes. We got some very positive responses and valuable feedback. Thank you for that!
For those of you who haven’t found the time to download or upgrade yet: Get Logaholic here.
If you’re upgrading a self hosted edition from Logaholic 3.x, this manual item is very helpful.
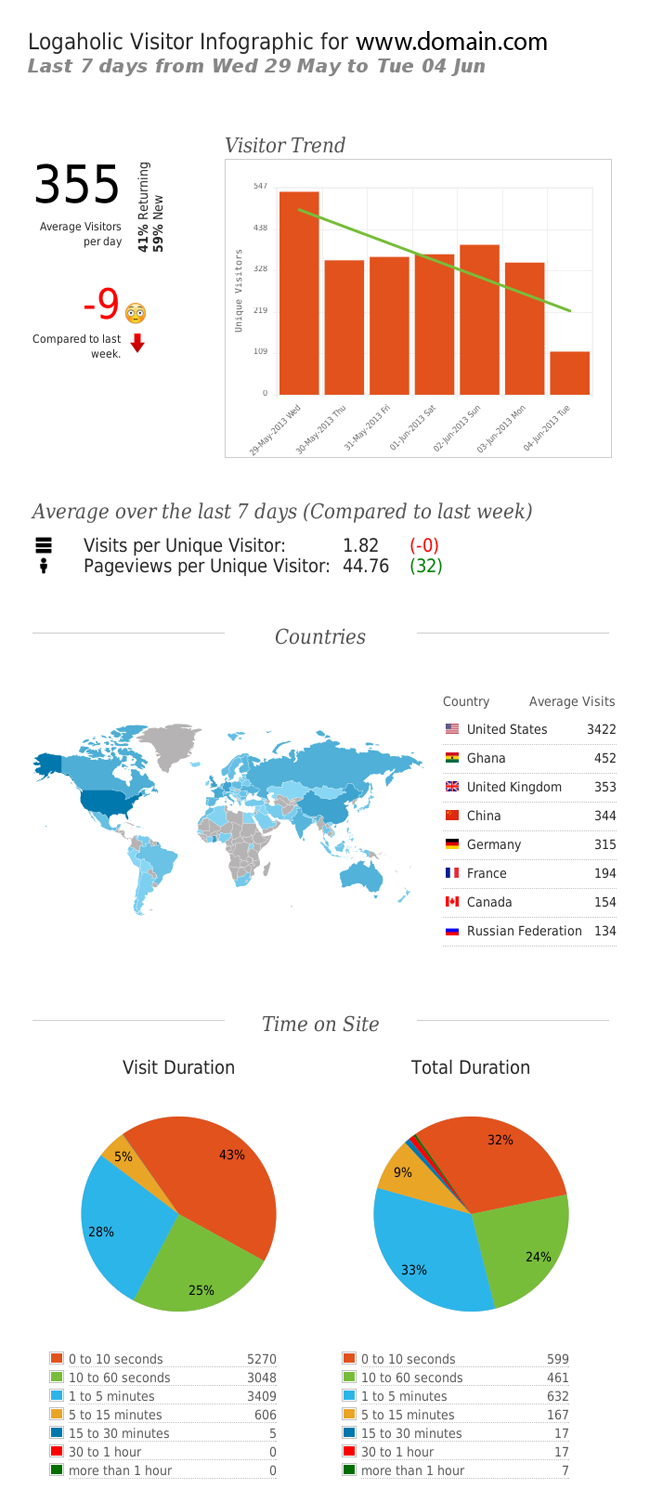
In this blogpost we’re introducing one of the great new features of Logaholic 4.0: Infographics.
These are graphical representations of your data centered around topics, so you can have all important statistics at your fingertips. It’s data displayed in its simplest form and therefore very easy to digest. Looking at an infographic, you should know immediately where you stand.
The screenshot below gives you an idea of how your data will be visualized in a Logaholic Visitor infographic.

In Logaholic 4.0, three default infographics are available, based around the following themes: Visitor, Content and Traffic. You can configure Logaholic to send them automatically to your email account, showing your recent stats without having to log into Logaholic. This way you will be kept up-to-date on a regular basis and you’ll closely monitor any developments on your site. Automated infographic emails are sent three times a week, each of them containing a different topic.
Setting up Infographic emails
Step 1. Make sure your current version of Logaholic is 4.x
Step 2. Open “Edit Profile” in the software and choose the “Automation” tab. Click “Manage Email Alerts”
Step 3. Under “Create a new email alert” fill in your email address and check the box “Send Infographics”
Step 4. Save the new email alert and you’re done! Infographics containing your data will now be send three times a week.
 admin, June 5, 2013