author admin, July 7, 2017

In web analytics, conversion rate is the percentage of users who take a desired action. These actions can include signing up for a service, downloading a file, subscribing to a newsletter, making a sale etc..

The conversion rate is one of the most useful website metrics in the web analytics toolkit because it’s a great way to measure the quality of your website traffic, your website content and your offer.

It is also a great basis for ad spending. Simply put, if you know it takes 100 visitors to make a $20 sale, you know you can’t pay more than 20 cents per visitor before you start to loose money.

However, often the conversion rate is calculated over all your traffic, in which case the results can be misleading.

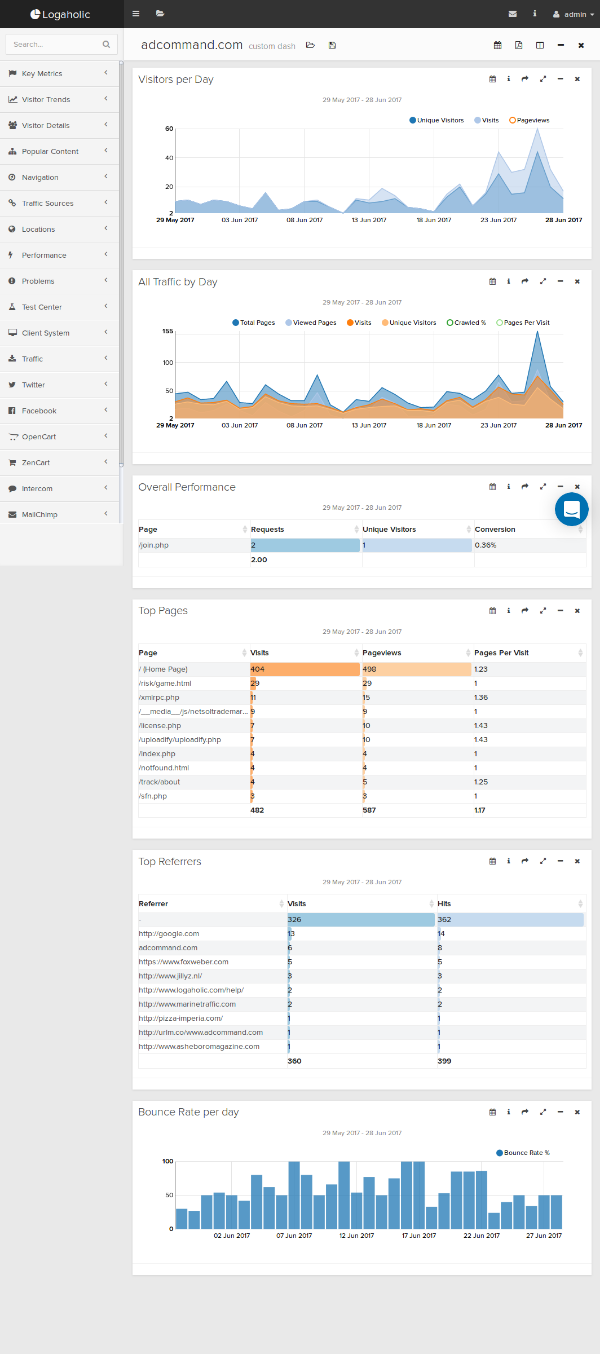
If your site gets a total of 500 visitors a day and 10 visitors converted, your conversion rate is 10/500*100 = 2%. Simple right?

The problem with that is that not all traffic is created equal.

Different visitors have different motives and circumstances under which they visit your site. Some may have no interest in your offer to begin with, some may have landed on your site for whatever reason, without any intent to ever convert… they just don’t fit.

It might be nice to have them on your site, but these aren’t the people you are looking for when you set up Adwords ads or a Facebook campaign, or when you try to optimize a page’s conversion rate.

What we really want to know is: who are our customers? What does that traffic look like and how can we get more of that.

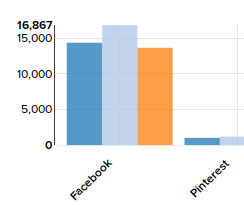
From our example above, let’s say all our paying customers come from the US, but over half of our website visitors come from other countries. In this case, it’s much more interesting to consider these separate groups when calculating our conversion rate.

In web analytics, segmentation refers to looking at parts of your data, rather than everything in total.

Knowing our customers come from certain countries is a great way to divide our visitors into more meaningful buckets, or “segments”.

In our example, even though our overall conversion rate may be just 2%, for the audience we actually care about the REAL conversion rate is double that, 4%.

That also means we can spend twice as much on advertising per visitor, provided we target the ads to the same type of visitor segment.

So, how do we find our customer segments?

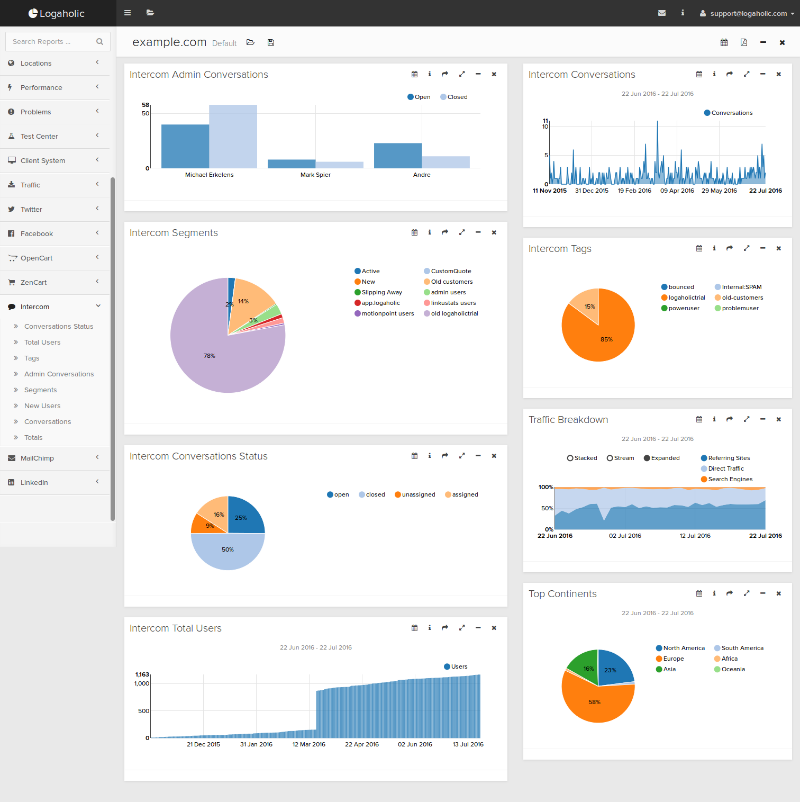
This is where your web analytics tool comes in. You’ll need a tool that allows you to segment your traffic and run reports on just that group of visitors.

In Logaholic, you would create a segment based on one of your target actions, for example:

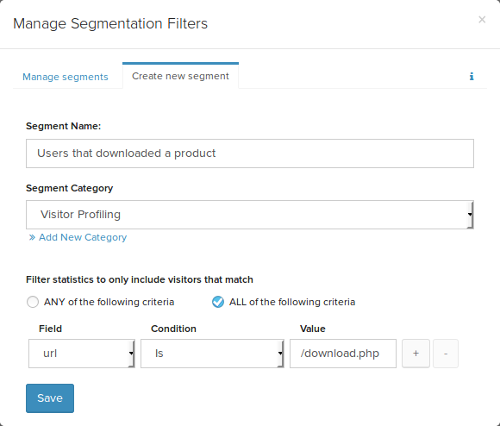
Then you can run that segment of reports like Top Countries, Top Referrers, Top keywords and so on to find out where these converted visitors are from and how they got to your web site.

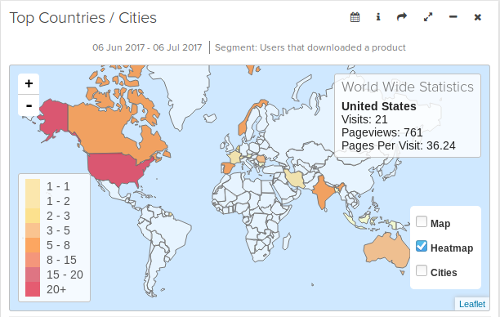
Using this information, you can create new segments that define your customers groups more closely. For example from US with referrer Google or Facebook kittens group…. whatever works for your traffic.

Once you’ve done that, its time to check your conversion rates again.

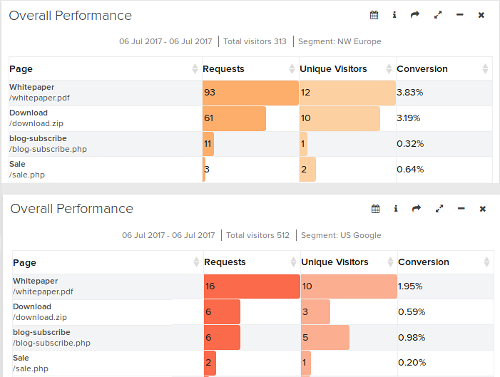
You now have multiple conversion rates for multiple desired actions across multiple visitor segments. This gives you a much better picture of what kind of visitor you are after and what they are worth.

Real conversion rate

Armed with this information, you’ll be able to target your ads in systems like Google Adwords, Facebook and others more accurately. That should also help bring your cost per visitor down.

Looking at your conversion rate through the lens of a segment will also allow you to spot differences in preferences between your segments. You can use this to tailor content on your website to certain groups, to increase your conversion rate even more.

author admin, June 30, 2017

Anyone with a website knows it’s important to have access to website metrics. You need to know how many visitors you are getting, where they are coming from and what they are doing on your site.

So I am sure you already have one of the many web analytics tools in place, even if it’s only Google Analytics.

But let’s be honest, how often do you really check your site metrics?

My guess is; not too often. In fact, our data suggests most people don’t view website traffic reports more than once a month.

The problem with that is that one day, even if you have the best analytics tools, you’ll open up your reports and be like this:

When you find out your website metrics are 0

Now, I’m not suggesting you dwell on all your site metrics every day, because for most of the numbers once a month is fine.

But there are a few you should be monitoring closely. These website metrics can reveal disaster or fortune. Left unchecked they can cost you dearly when traffic patterns suddenly change.

You don’t want to find out your traffic collapsed 3 weeks ago or that Google has banned your site! Likewise, it might be nice to know you made the front page of Reddit and there is smoke coming out of your server!

So here goes, my choice of essential website metrics to check each day:

1. Visitors and pageviews

This one should speak for its self. Monitoring the daily number of unique visitors and pageviews is an easy way to check if your site is performing as expected. Any large dips or spikes will be easy to spot and allow you to investigate further.

2. Conversion rates

Visitors and pageviews tell you something about the quantity of your website traffic. Your conversion rates will tell you something about the quality of that traffic.

Of course you shouldn’t just measure conversion to your sales confirmation page. You should also measure it for things like newsletter sign ups, contact forms and key pages involved in your customer’s journey.

So make sure you have your conversion tracking set up. Its called Goal Url’s in Google Analytics, Logaholic calls it Key Performance Indicators.

If you haven’t done so already, set it up now! Because you will want to know if your website traffic is converting the way it should on a daily basis.

3. Top Pages

Make sure to include a top 10 or top 20 pages report in your daily review. You want to keep tabs on what the most popular content on your site is. If one of your pages suddenly gets a lot of traffic, you want to catch that in time so you can make any changes or improvements to that page while it’s hot.

4. Top Referrers

Like pages, you want to know where your traffic is coming from so you can respond when needed.

5. Bounce Rate

A “Bounced visitor” is a user that accessed only one page on your site and then left. In general, large changes to your daily bounce rate mean something fishy is going on and it’s time to take action.

Other website metrics

These 5 site metrics are available in most web analytics tools, but there are many more website metrics. You can find a list of web analytics definitions here.

Get your daily dose automatically

Logaholic makes it very easy to organize these reports in a dashboard so you can always access your website metrics quickly.

Also, Logaholic allows you to set up daily emails with your own choice of reports. You won’t even have to go log in to your reporting system, they automatically land in your inbox every day.

5 website metrics

author admin, February 10, 2017

We’re happy to announce the release of Logaholic 6.0.9. This version features lots of improvements and some powerful new features.
 

New insights in browsers and operating systems by country

The new Logaholic reports called Browsers by Country and OS by Country provide a powerful breakdown of browser and OS preferences in two great new visualizations:

Sunburst Visualization:

Peek 2017-02-09 22-56

Drilldown Visualization:

Peek 2017-02-09 23-09


Social Media break down and Trends

This report breaks down your analytics by social media platform, find out how many visitors you are getting from all major sites, like Facebook, Linkedin, Youtube, Instagram and many more, including international platforms like Weibo and vKontakte.
social media analytics
 

Desktop or Mobile?

Mobile internet usage is going though the roof, but that impacts some sites and web apps much more than others. So it’s time to know: How much of your traffic is mobile?

desktopvmob
 

More trends

A new Visitors per Year report lets you easily compare your traffic from year to year. The OS Trends report give you a high level view of changing OS usage. The All Traffic by Type report gives a birds eye view of how Logaholic has classified your traffic.

trafficbytype
 

Power features for serious analysts

We’ve added some features that might not be at the top of the list for everyday users, but our power users have told us they need it – so we built it!

Private Dashboards:

If you are sharing profiles and dashboards with your clients, it’s sometimes nice to have a private dashboard that only you can see.

Global and Private Segments:

Logaholic’s segmentation filters are great for slicing and dicing your data into cohorts that are more valuable when analyzed separately. If you have a lot of profiles, you can now make global segments that are instantly available in all your profiles. Or, you can make the segment private, so only you can see it.

Custom cookie tracking and user identification:

Imagine being able to identify your visitors by email or username across all your web analytics reports. Custom cookie tracking now makes it possible to use any cookie your site or web app might use to identify a visitor and pass that to logaholic as the main visitor ID.

Dashboard layout options:

It now possible to change the number of columns in your dashboard – from 2 up to 6 columns (some people must have really big screens)!
 

Improvements

This version also has improved translations – so you can enjoy your stats in German just as much as in English.

Data export options like CSV and JSON have been improved and enabled on more reports. Your data – use it however you want.

On screen tutorials have been improved to get you up and running with Logaholic in no time.

Logaholic 6.0.9 is now available on our Saas platform or as download.

author admin, July 22, 2016

We’ve just released an update to Logaholic Web Analytics. This release introduces two exciting new integrations, MailChimp and Intercom.

screenshot-app logaholic com 2016-07-22 13-26-12

This allows you to bring in data about your Email marketing campaigns into your Logaholic Dashboard. For MailChimp, the following reports are now available:

  • Campaign Opens
  • Campaign Stats
  • Campaign Forwards
  • Facebook Likes
  • List Rate
  • Campaign Clicks
  • List Stats
  • Campaign Bounces

For Intercom, these reports are now available:

  • Conversation Status
  • Total Users
  • Tags
  • Segments
  • Conversations
  • New users
  • Totals

Logaholic 6.0.5 is available here.

author admin, July 8, 2016

We’ve just released Logaholic version 6.0.3. This release introduces a new integration: LinkedIn Analytics.

We’ve added 5 LinkedIn reports for you. These can be connected to your LinkedIn company page and will show you:

  • Total Followers per month
  • New Followers per month
  • Content Impressions per day
  • Organic/Paid and Total Followers per day
  • Monthly graphs on Clicks, Impressions, Comments, Likes, Shares and Engagement

Now you can add your favourite LinkedIn insights right into any dashboards, combined with your web analytics, facebook stats, ecommerce reports … everything in one place.

Logaholic 6.0.3 also fixes some other minor bugs, so download it here now: http://www.logaholic.com/download/