author admin, May 1, 2018

Last week we introduced Logaholic 7.1, which adds a feature than can automatically analyze Web Analytics trends. We call it the News report. Since we’re pretty excited about this feature, let’s go ahead and take a closer look.


Source: xkcd

What’s the problem?

The problem with checking your Web Analytics regularly is that it often takes a lot of time because there is so much information.

Rather than just looking at a bunch of numbers on a screen you want to try to find meaning in the data. Why are my visitor numbers going up or down? Is my traffic from Google converting into customers? Where did that sudden spike in pageviews come from?

To answer these questions we need to closely look at multiple reports, charts and graphs, which can be time consuming.

The premise of the News report is that it will analyze the trends in your data for you, so you don’t have to spend any time on that.

The News report will show you a text digest, highlighting any noteworthy events in your data. To do this the News report looks at a number of Web Analytics trends. These are:

  • Visitors and pageviews
  • Country trends
  • Page trends
  • Referrer trends
  • Error trends
  • Conversion trends
  • Keyword trends
  • Bot/Crawler trends

The report identifies any significant events by calculating the standard score (also called Z-Score). For weekdays, the average used to evaluate an observation are based on all weekdays within the selected date range. Saturdays and Sundays use separate averages for each day.

In statistics, the standard score is the signed number of standard deviations by which the value of an observation or data point is above the mean value of what is being observed or measured.

https://en.wikipedia.org/wiki/Standard_score

The report will allow you to choose a default z-score, which will determine how sensitive it is to changes in your data. This will result in an increase or decrease the number of news items you see in the report.

Let’s take a look at an example below:

Notice the news items are categorized by topic, and color coded to reflect the rise or decrease observed.

The topic of any news item can be clicked to pull up a context menu which will allow you to investigate the issue further. The menu will give you quick access to different reports in the software like trends, conversion rates or anything else that is relevant to the context of the news item.

This makes the News report the ideal starting point for investigating your traffic. It will give you an instant overview of the most important events that occurred in your data since the last time you looked and provide you with a targeted entry point for deeper analysis.

The News report is available in Logaholic 7.1 and were happy to announce that it’s in the free version so everyone can use it out of the box.

author admin, January 2, 2018

By “Fake”, I mean that this traffic it is not generated by humans, but by a myriad of scripts, bots and other automated processes. Some are well intentioned, but most are not. These busy little bees scan for vulnerabilities on your site, wordpress login pages, test scripts and a 1001 other things.

If you only use javascript tags to collect data about your website visitors (i.e. like Google Analytics), you have absolutely no idea that this is going on. You have no idea that so much of your bandwidth and server resources are being consumed by agents that are trying to damage you.

The only way to find out what all these creepy crawlers are up to is to analyze your website’s log file. However, the results can be overwhelming compared to tag based data collection.

Ignorance is bliss

Bots usually don’t read javascript files, which means they do not show up in javascript based solutions like Google Analytics. As a result, the numbers you see mostly represent real humans. This is a nice side effect, because for marketing purposes we are usually only interested in humans.

If you’re analyzing log files, this becomes more difficult. You have a lot more information, but how to see which visitors are real and which ones are not?

As the number of malicious bots has skyrocketed over the last year, log file based analytics have diverged more and more from the javascript based numbers.

Until now, log file based analytics has mostly relied on bot detection via the information in the user agent. This catches most of the “legitimate bots” which are left out of most reports by default.

Evil bots however try to pose as real users so these usually slip through the cracks, inflating the number of visitors compared to a javascript tracker.

Best of both worlds

To solve this problem, Logaholic 7 now features “Behavior Based” bot detection. This classifies all clients as a “bot”, unless it behaves like a human. For example, when the client requests both html and images or javascript during a visit.

In terms of bot detection, you’re now guilty until proven innocent, not the other way around.

Most reports in Logaholic display only “human” data by default, but can be switched to “all traffic” to see what the creepy crawlers are up to.

This way you have useful reports from the marketing perspective, but also from the security and IT perspective.

All new Logaholic profiles using log files will be automatically set to Behavior Based detection. Existing profiles can be switched manually – but prepare for a massive drop in visitors … and don’t shoot the messenger 🙂

Get Logaholic 7 now!

André, October 23, 2017

This article shows you how to setup Logaholic on Windows server 2012 R2 running IIS 8.5.

Before we start its important that your Windows Server 2012 R2 is up to date. It should have the latest updates and patches that Microsoft has released. Some of the required Microsoft components will fail to install if your server is not up to date.

When your server is setup right, has the latest updates and running as it should we advise you to use Microsoft Web Platform Installer http://www.microsoft.com/web/downloads/platform.aspx to setup Php and MySql. For this article we installed Php 5.6.31 and MySql 5.7.19 but you should be fine with the other versions as well that are listed with Microsoft Web Platform Installer 5.0.

Before you start we advise you to install Fast CGI, this is included in your Windows server however not installed by default.

So go to your Windows Explorer, select Computer from the top menu and then select uninstall or change a program. Next select turn Windows features on or off. Add Roles and Features Wizard starts up. Select in left pane Server Roles, under Roles open Webserver IIS, open Web Server, Open Application development and select CGI, click next and complete the wizard.

When done you should see a Fast Cgi icon appear in your IIS UI home pane when you select a site in the left pane of IIS UI.

Find some documentation here:
https://docs.microsoft.com/en-us/iis/configuration/system.webserver/fastcgi/#setup

Now go to http://www.microsoft.com/web/downloads/platform.aspx and install Microsoft Web Platform installer or run it if you already installed it before.

Search for Php, when you select Php 5.6 the installer will automatically select an additional 3 components please install all 4 by following on screen instructions. After the wizard is done you may want to check that PHP installed as expected.

To test your PHP installation

  1. Open a text editor on your server, for example Notepad, as Administrator.
  2. In a new file, type the following text:
  3. Save the file as C:\inetpub\wwwroot\Phpinfo.php.
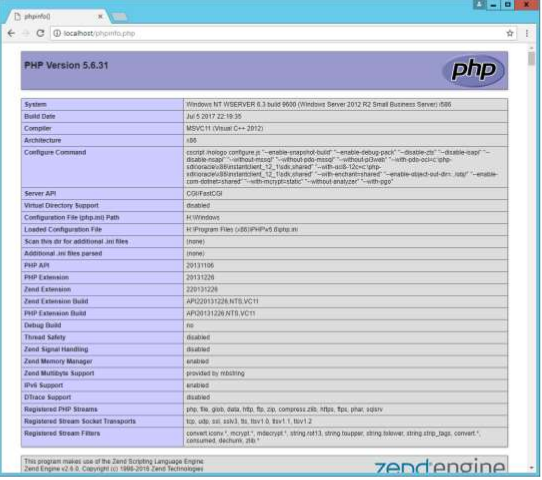
  4. Open a browser on your server and enter the following URL: http://localhost/phpinfo.php

A webpage like below should load, showing current PHP settings.

Next open your Microsoft Web Platform installer again, search for MySql select and install it. We could have done this in 1 go with Php but I think its better to do this separate. Follow the on screen instructions when the MySql installer runs. MySql proposes to install Microsoft Visual Studio C+++ dependent on your platform 32/64bit this could be 3 ? 5 additional redistributables.

Click execute when MySql installer offers to find and install MsVs, obviously when MsVs is already installed on your server you can just click install. When MsVs is successfully installed click install and complete the MySql installation.

Reboot your Server.

When your server is back up again Open IIS in the left pane click your server. In the home pane under IIS you should see a Fast CGI settings icon. Double click this Icon. This should reveal the absolute path to your Php installation. See below picture. Remember this youll will need this later.

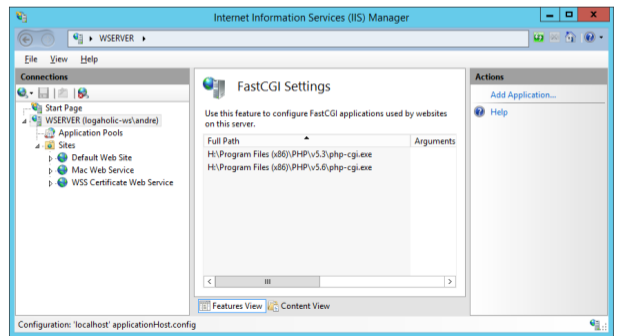
Fast CGI Settings in IIS 8.5 for Logaholic Web Analytics

Download Logaholic latest version www.logaholic.com/download. Un pack the downloaded file. You will find a folder called Logaholic. Copy the folder Logaholic and paste it in the root of your website in our case we followed the default installation layout of the Windows server 2012 R2.

Logaholic was pasted in the folder wwwroot C:\inetpub\wwwroot\logaholic\

Now open a browser on your server and go to http://localhost/Logaholic/install.php Logaholic’s installation procedure will load in your browser.

Please follow these instructions http://www.logaholic.com/manual/installation/set-up-wizard/

When you have submitted all requested data in the setup screen Logaholic will check if your php settings and folder permission are correctly set up. Most likely Logaholic will report on some php settings that have to be corrected. Locate the php.ini file in the PHP directory with highest version number, you had revealed the path earlier in the Fast Cgi component see above. Open php.ini in a text editor in administrator mode. Correct the reported settings. Find some more information here:
http://www.logaholic.com/manual/installation/php-settings/

Click Recheck in Logaholic’s installation wizard to see if the Php settings pass.

Most likely you will see in the Installation wizard that Logaholic reports it cannot write to the Folders Data, Files and Temp. This can be kind of a challenge to correct under IIS.

Applications that run under IIS require an account that has sufficient permissions. You wont be able to find this account for security reasons this account is hidden. The account name is derived from the website names and application pools that are running under IIS on your server. Our server still has default settings and names so the account we have to give sufficient permissions for writing to the folder Data, Files and Temp is called DefaultAppPool and is its a member of the IIS APPPOOL group.

To set the appropriate permission:
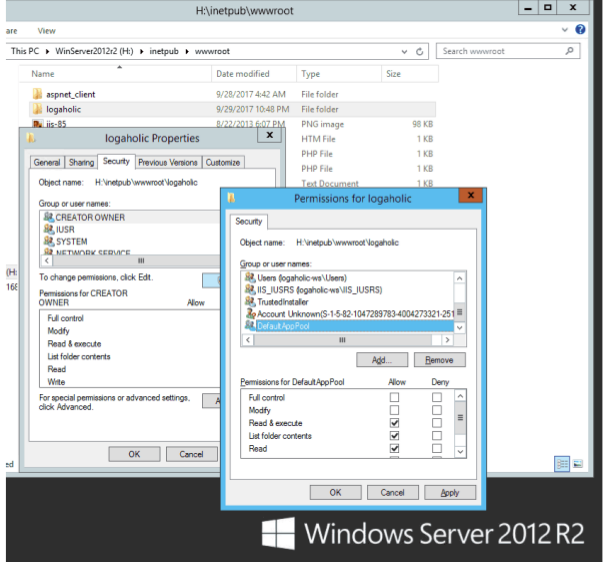
Select (in Windows Explorer) the properties of the Logaholic directory.
(C:\inetpub\wwwroot\logaholic\)

Choose the Security Tab, click Edit and then click Add.
Click locations, select server name and click ok. For “Enter the object names to select”, enter: IIS APPPOOL\DefaultAppPool
Then 3X ok.
(DefaultAppPool is the default account name, if your website has another name then default then use different name replace DefaultAppPool for different name)

Now set writing permissions for DefaultAppPool on the Logaholic folder.
Go to IIS UI Connections pane select Logaholic, double click Authentications Icon, edit Anonymous Authentication, set to Application Pool identity.

Now you should be able to complete the setup of Logaholic.
For more information see https://technet.microsoft.com/en-us/library/hh994613(v=ws.11).aspx

For security reasons remove earlier set writing permissions for account DefaultAppPool in the Logaholic directory, as follows:
Still assuming you are using the default setup locations of your Windows server, if not replace loactions and used account names accordingly.

Open Windows Explorer, go to C:\inetpub\wwwroot\logaholic\ right click the Logaholic folder, choose properties, choose the Security Tab, click Edit, Under user names/groups choose “DefaultAppPool”, under Permissions for DefaultAppPool un-tick “write” and save.
Next.
Go to C:\inetpub\wwwroot\logaholic\data\ right click the “data” folder, choose properties, choose the Security Tab, click Edit, Under user names/groups choose “DefaultAppPool”, under Permissions for DefaultAppPool tick “write” and save.
Next.
Go to C:\inetpub\wwwroot\logaholic\files\ right click the “files” folder, choose properties, choose the Security Tab, click Edit, Under user names/groups choose “DefaultAppPool”, under Permissions for DefaultAppPool tick “write” and save.

Next you can go ahead and configure necessary profiles in Logaholic for more information see: http://www.logaholic.com/manual/profile-configuration/

Logaholic enables you to track visitors through Web server log files and/or through the included java tracker. Should you decide to use your web server log files to track visitors you will have to allow “read” permissions to the above mentioned DefaultAppPool for the folder where your log files reside. By default IIS 8.5 on Windows server 2012 R2 stores logfiles in C:\inetpub\logs\LogFiles\W3SVC1\. Allow DefaultAppPool write permissions as followes:

Right click folder “W3SVC1”, choose properties, choose the Security Tab, click Edit, Under user names/groups choose “DefaultAppPool”, under Permissions for DefaultAppPool tick “read” and save.

You will find more information on the above mentioned tracking methods here.

author admin, September 18, 2017

Today we have a guest post by Gilad Maayan from the Web Analytics & BI Wiki:

In today’s fast-paced industry, companies face multiple challenges as they attempt to form a solid marketing strategy that meets business objectives. These challenges include managing marketing technology across the organization, difficulties in reaching prospects, driving customer engagement across a multitude of platforms, and tackling the complex world of web analytics.

Apparently, tackling analytics for your website is a challenge even for seasoned marketers. A recent survey by Think with Google uncovered specific challenges related to analytics technologies – namely, 61% of marketing decision makers struggled to access or integrate the data they needed in 2016.

Here are three types of web analytics challenges businesses are dealing with today and some ideas on how to solve them.

1. Too Many Metrics

In today’s industry, access to web metrics is the name of the game. But many marketing teams tend to go too far and become web analytics fanatics. Knowing which metrics to measure is important, but how do you make sure you’re measuring the right metrics? Or maybe you’re using too many metrics, without clear guidelines on what to do with the results?

According to Jay Baer of Convince & Convert, just because you can measure something, doesnt mean you should. Identify the metrics that are important to your business goals. Don’t measure all metrics obsessively, but identify the few metrics that do require closer attention, such as visitors and pageviews, conversion rates, top pages, and more.

2. Data Accuracy and Data Security Issues

Another challenge related to web analytics is that site performance data isn’t always accurate. Issues such as missing tracking code on web pages, data sampling with skewed results, ad block services that filter out valuable analytics data, and incorrect data filters are only a few examples of where you things can go wrong.

Beyond plain website analytics, mobile and web apps introduce additional complexities. Even if your mobile app analytics is spot on and you’re tracking the right metrics for your apps, this doesn’t ensure that you have full visibility of your users’ various data sessions.

Make sure that untracked or overly exposed data isn’t causing privacy or security vulnerabilities. Recent data privacy regulations are forcing US companies to put data privacy front and center, reviewing data security policies and ensuring better workflow management to prevent data breaches or even cyber attacks.

A solid network is key to protecting the systems running behind the scenes, those systems in charge of your users’ data. Define proper monitoring procedures, put security testing in place, and make sure to reach full application visibility to track performance at all levels and protect your system against application-level threats.

3. Insufficient Knowledge

In the survey mentioned above by Think with Google, 26% of marketers said they didn’t have the right analytics talent to meet marketing objectives, such as improving campaign effectiveness. They reported it was a struggle to get buy-in and support from executives.

Even if your organization has already established a suite of web analytics tools to provide meaningful insights into user behavior, you might be working hard to deal with the information overload. Add web analytics dashboards, customer experience tools, heatmaps, and BI analytics into the mix, and you’re sure to be overwhelmed.

One way to address this challenge is to use a reporting platform that simplifies the way you view your data (take a look at Logaholic, which does just that).

But even before you drill into a specific metric or technology, you might need to take a step back, widen your perspective, and improve your general understanding of the space of web analytics, BI, and big data.

This was one of the motivations the Web Analytics & BI Wiki built by CoolaData – makers of a big data behavioral analytics platform. The team at CoolaData took on a project to make the available content about web analytics and BI for digital marketing more accessible. The wiki is the first knowledge hub that collects all the relevant information on the subject and organizes it in a meaningful structure.

There are many additional resources that can help you get a better grasp on BI and big data concepts, for example, gurus such as Avinash Kaushik can guide you through some first steps in figuring out web analytics.

Closing Thoughts

Most organizations are convinced they lag behind their peer group when it comes to deploying and managing the performance of marketing technology. The CMO of a Fortune 100 company was embarrassed to admit that her team struggled to manage all of their technology. Believe me – we are all in the same boat.
Source: http://www.cmswire.com/digital-marketing/5-challenges-marketers-must-face-in-2017/

For many companies, the acquisition and implementation of new technology has gotten ahead of the logistics of tracking and managing data that is already in place. In this article, we discussed three common challenges businesses face when incorporating web analytics technologies and how to tackle them.

But there are many more. The fast-changing digital marketing industry introduces daily questions: How should we address big data? How do we support a multitude of platforms, especially IoT devices? Which marketing processes should we automate, and how to improve existing automation?

Don’t run from your challenges – identify them, and find strategies to solve them. With a balance between the right tools, solid professional expertise, and knowledge about the latest trends, you’re already on the right track to meeting your goals.

author admin, July 7, 2017

In web analytics, conversion rate is the percentage of users who take a desired action. These actions can include signing up for a service, downloading a file, subscribing to a newsletter, making a sale etc..

The conversion rate is one of the most useful website metrics in the web analytics toolkit because it’s a great way to measure the quality of your website traffic, your website content and your offer.

It is also a great basis for ad spending. Simply put, if you know it takes 100 visitors to make a $20 sale, you know you can’t pay more than 20 cents per visitor before you start to loose money.

However, often the conversion rate is calculated over all your traffic, in which case the results can be misleading.

If your site gets a total of 500 visitors a day and 10 visitors converted, your conversion rate is 10/500*100 = 2%. Simple right?

The problem with that is that not all traffic is created equal.

Different visitors have different motives and circumstances under which they visit your site. Some may have no interest in your offer to begin with, some may have landed on your site for whatever reason, without any intent to ever convert… they just don’t fit.

It might be nice to have them on your site, but these aren’t the people you are looking for when you set up Adwords ads or a Facebook campaign, or when you try to optimize a page’s conversion rate.

What we really want to know is: who are our customers? What does that traffic look like and how can we get more of that.

From our example above, let’s say all our paying customers come from the US, but over half of our website visitors come from other countries. In this case, it’s much more interesting to consider these separate groups when calculating our conversion rate.

In web analytics, segmentation refers to looking at parts of your data, rather than everything in total.

Knowing our customers come from certain countries is a great way to divide our visitors into more meaningful buckets, or “segments”.

In our example, even though our overall conversion rate may be just 2%, for the audience we actually care about the REAL conversion rate is double that, 4%.

That also means we can spend twice as much on advertising per visitor, provided we target the ads to the same type of visitor segment.

So, how do we find our customer segments?

This is where your web analytics tool comes in. You’ll need a tool that allows you to segment your traffic and run reports on just that group of visitors.

In Logaholic, you would create a segment based on one of your target actions, for example:

Then you can run that segment of reports like Top Countries, Top Referrers, Top keywords and so on to find out where these converted visitors are from and how they got to your web site.

Using this information, you can create new segments that define your customers groups more closely. For example from US with referrer Google or Facebook kittens group…. whatever works for your traffic.

Once you’ve done that, its time to check your conversion rates again.

You now have multiple conversion rates for multiple desired actions across multiple visitor segments. This gives you a much better picture of what kind of visitor you are after and what they are worth.

Real conversion rate

Armed with this information, you’ll be able to target your ads in systems like Google Adwords, Facebook and others more accurately. That should also help bring your cost per visitor down.

Looking at your conversion rate through the lens of a segment will also allow you to spot differences in preferences between your segments. You can use this to tailor content on your website to certain groups, to increase your conversion rate even more.