Get Started
Company
Copyright © 2022. Logaholic Web Analytics BV
In the following section we explain all of Logaholic’s web analytics reports. We devided them in the following categories:
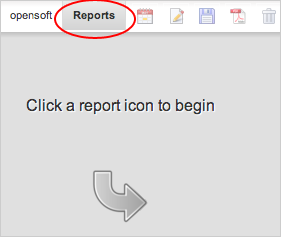
Logaholic reports can be accessed through the “Reports” tab in the top menu.