 admin, April 26, 2018
We’re happy to announce the immediate release of Logaholic version 7.1. This version adds a range of new reports and features.
Introducing the News report
Everybody loves a good chart. A line chart is a great for spotting changes and trends, but there are a lot of charts to cover. Sometimes you just don’t have the time.
That’s where the Logaholic News Report comes in. It analyzes all the trends for you and singles out events that are noteworthy. That way you have an instant overview of any important changes or events in your data.
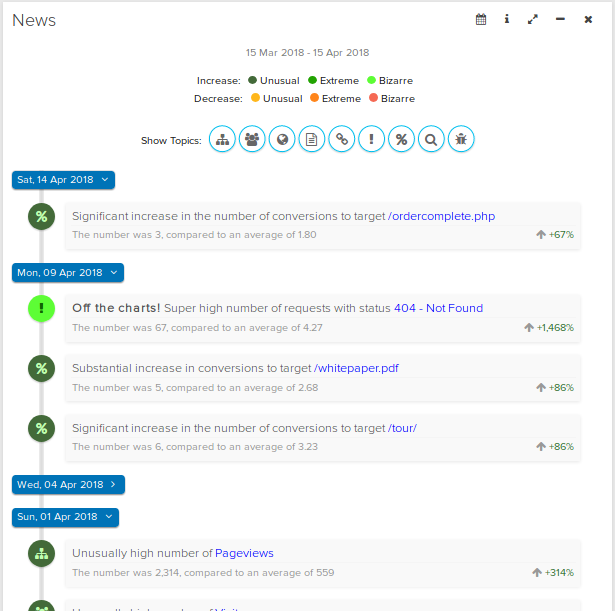
Any news item can be clicked to bring up a context menu that will allow you to investigate further. It’s the perfect starting point for a quick dive into your stats!
Introducing UTM reports
In this version we’ve added full support for UTM parameters. We’ve included a UTM breakdown report and separate reports for all 5 parameters so you can view your traffic by source, campaign, medium, term and content.
Any UTM parameter can be easily turned into a Logaholic segmentation filter for further analysis in other reports.
New javascript tracking tag
We’ve also updated our tracking code. It now collects more data and has even less impact on browsing speed. If you are currently using our tracking tag, it’s important to update the code in your pages when you upgrade to Logaholic 7.1. Of course, it’s also backward compatible with older versions of the tag.
The new data allowed us to add these new reports:
- Ad Blockers; shows you what percentage of visitors are using an Ad blocker
- Page Load Time; show you the average time it took for your website’s pages to load in the browser
- Time on Page; shows you how long visitors spend on any particular page.
- Page Scroll Depth: shows you how far your visitors scrolled down a page.
You can combine our new javascript tracking tag with analyzing your log files. That way you get the benefits from both data collection methods.
Adwords traffic verification
We’ve also added 2 reports to help you verify the traffic you may be getting from Google Adwords campaigns.
Adwords Clicks per Day shows you how many unique visitors clicked, how many clicks per user and how many of those might be bots.
Adwords Clicks per User shows you the Adwords traffic on a user level, down to the actual IP number.
This information has already helped several Logaholic users get refunds from Google on some of their ad expenditure.
Logaholic 7.1 is now available on our site, please enjoy and let us know what you think!