author admin, May 22, 2013

Logaholic officially announces the Beta release of Logaholic Version 4.0.

Included in this brand new software version are all kinds of speed optimizations, new features and other improvements.

Quick Overview:
– Added Datamanager, including:
– Quick import/export of Logaholic’s Log files
– Possibility to choose own path location for data files
– Ability to adjust data file storage size
– Set maximum date range for database storage
– Much faster perl/php log analysis process
– Lightning fast report generation (even with large data sets)
– New report option: Load reports from multiple profiles into one dashboard
– New browser visualization
– Search is now case insensitive
– Top Countries / Cities has a new map
– Unique visitors is replaced with visits in many reports.
– New feature: Generate and email Infographics
– Automatically mail dashboards in PDF format
– New feature: Inpage Analytics
– Create subscription packages (SPE only)
– Improved useragent detection
– Improved PDF creator
– Log file processing is now done in the background

Datamanager
New in Logaholic 4 is the ‘Datamanager’, which helps you to clean up your database. By deleting old data from your database, it becomes smaller and faster. It comes with a new and improved way of processing data. As a result, reports in Logaholic load much faster than before, especially if you have large sites with lots of traffic (Big Data). You’ll be spending more of your valuable time analyzing statistics.

In the video below we introduce you to the new Datamanager settings. (view in HD for best results)

To learn more about the Datamanager function within Logaholic 4, please visit the manual section: Datamanager.

Reports
As of version 4, it is possible to switch between profiles in the report options. If you use Logaholic for multiple website’s, you can create a custom dashboard where you include all your favorite statistics from those website’s!

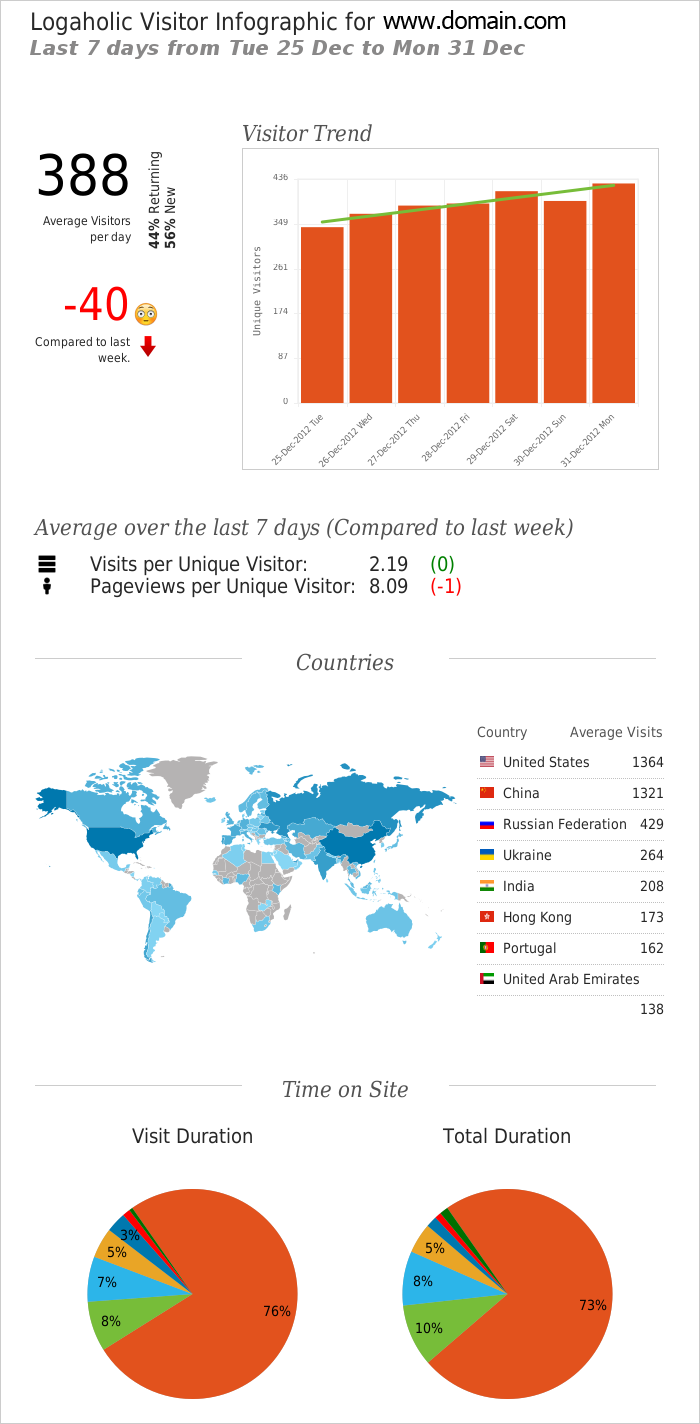
Another great new feature is Logaholic’s ability to create Infographics. These are graphical representations of your data centered around topics, so you can have all important statistics at your fingertips. In Logaholic 4, three default infographics will be available. They’re based around the following themes: Visitor, Content and Traffic.

Inpage Analytics
With the new feature ‘Inpage Analytics’ you’ll be able to make a visual representation of your statistics, in order to determine how people use your website. The data is loaded from your Logaholic account and is literally displayed IN your website. With inpage analytics you’ll find answers to questions like: ‘Which links are being clicked on?’ or ‘Do visitors really find what you want them to find?’

In the video below we tried to give you a first impression (view in HD mode for best results).

Email Alerts
Two mailing functionalities were added. From now on it is possible to send your personal dashboards on a daily, weekly or monthly basis to your preferred email address. You can now also schedule infographics for delivery via email. Send these alerts automatically to any email account to receive your recent statistics without having to log into Logaholic. Infographic emails are sent three times a week, each of them comprising different stats.

Subscriptions
By popular request we have added a ‘Subscription’ functionality. This new feature is especially interesting for service providers. With this brand new option in Logaholic, server providers are able to allocate reports to their users. Thus, it becomes possible to put together custom Logaholic report packages for clients.

Global
Several other improvements were made on the global scale to enhance your web analytics experience with Logaholic. Probably the most exciting one is the incredible speed increase in this version. Another improvement is enhanced user agent detection. Also, our PDF creator is much better now.

There’s more, but we don’t want to bore you. We hope you will enjoy Logaholic 4.0 as much as we do. Please let us know what you think, your feedback is always very much appreciated.

Try Logaholic 4.0 by downloading the Beta version here.
If you’re upgrading from Logaholic 3.x, please find instructions here.

You can also visit the online demo version here.

author admin, May 14, 2013

Over the past months our team has been working hard on a major new version of Logaholic. And we’re happy to announce that it’s almost done! Logaholic 4.0 is soon to be released. This version of the software includes many changes. Please continue reading and learn more about some important new features and improvements.

Speed Optimization

Speed optimization has been a key objective during the development of Logaholic 4. We booked some major results here. From Logaholic version 4, it is no longer necessary to store all your data in a mysql database permanently due to a new flat file storage system. This means you can delete old data from your database, keeping it small and much faster. It also means reports in Logaholic load much faster than before, especially if your have a large site with lots of traffic.

And that’s not the only thing we did to optimize speed within Logaholic. We completely rebuild the update process in both PHP and Perl to get you to your stats even faster.

Inpage Analytics

In addition to speed improvements, some new features were added. One of the most exciting new features of Logaholic 4.0 is Inpage Analytics. As the name suggests, it’s web analytics literally IN your web pages.

Once you activate inpage analytics on your website, you will be able to get all the essential page statistics (like click through rates, visitor trends and so on) while you browse your site. No need to visit the Logaholic application!

In the video below we tried to give you a first impression (view in HD mode for best results).


Infographics

Another great new feature is Logaholic’s ability to create Infographics.

These are graphical representations of your data centered around topics, so you can have all important statistics at your fingertips. In Logaholic 4.0, three default infographics will be available. They’re based around the following themes: Visitor, Content and Traffic.

You can send them automatically to your email account, showing your recent statistics without having to log into Logaholic. Emails are sent three times a week, each of them containing another Logaholic infographic.

The screenshot on the right gives you an idea of how your data will be visualized in a Logaholic infographic.

Automated PDF reports

You can now not only generate PDF versions of your dashboards on the fly, you can also schedule them to be delivered to any email address daily, weekly or monthly. Great if you need to keep those darn managers up to date with some carefully selected reports 🙂

Logaholic 4 is about to release very soon. We’ll let you know as soon as we get there. Make sure to keep up with this blog and you’ll definitely be the first to know about it.

author admin, February 13, 2013

We updated Logaholic to version 3.2.3

Newly added to the software:
– Added an option to delete all your dashboards on the profile ‘Maintenance’ page.

The new version contains the following bug fixes:
– Fixed problem in ‘Keyword Trends’ when keywords have a single quote
– ‘Bandwidth’ now uses data in days and not in hours
– Fixed Timezone offset setting for System.
– Fixed ‘Goals’ gauge meter bug.
– Fixed dashboards bugs.
– Fixed ‘Page Analysis’ traffic selector bug.
– Fixed bug when searching for a keyword in ‘Top Kewords’ and ‘Top Keywords Details’

Download the new version here >.

Kind regards,
The Logaholic Team

author admin,

Today we updated Logaholic to version 3.2. The new version contains some minor bug fixes.
We fixed a few bugs related to the date-picker and the time-zone settings. Next to that, we fixed a bug in bounce rate metrics.

Download the new version here.

Kind regards,
The Logaholic Team

author admin,

Logaholic now offers the Self Hosted Edition in 3 flavors; Basic, Advanced and Enterprise. The basic package includes 50 reports, the Advanced package includes 80 different reports and the Enterprise package includes all the reports we currently have available (over 110).

We have done this based on feedback from our customers, many of whom wanted to have a simple way to get a collection of premium reports for all their website profiles, rather than purchase them individually via the Logaholic Report Store.

Great deals
Check out the details on our new Pricing page now!

To find out which reports are included in a particular package, please check the Features page.

What does this mean for recent customers?
If you bought or upgraded in the past few months, you will be automatically upgraded to the Advanced package the next time your download a new version of Logaholic from your Order History page.