author admin, July 24, 2013

Most website owners don’t know which web browsers are used by their visitors. Unfortunate, because compatibility issues can lead to huge differences in how a website is displayed.

Having knowledge about the browser (versions) is very important. As a website owner you should always make sure that your site is cross-browser-compatible. But, why would you spend time and money making your website compatible with IE 5 while almost none of your visitors use it anymore? With Logaholic you know where to put your efforts so you can optimize your site more effectively!

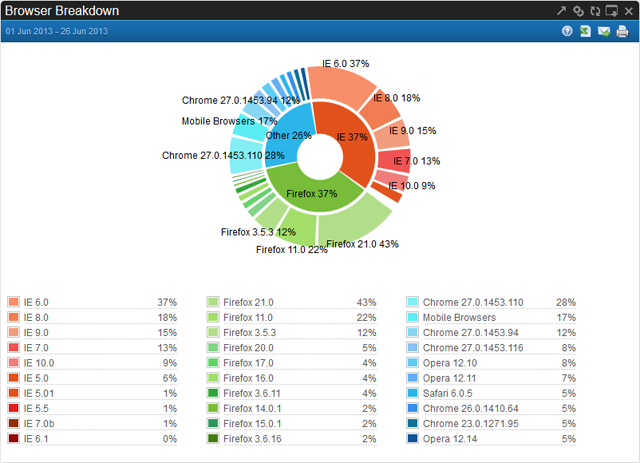
Logaholic 4 includes many new features. One of them is the completely renewed browser visualisation. Logaholic’s Browser Breakdown report has taken a huge leap forward, displaying a sophisticated donut graph by default.

As you can see in the screenshot below, we distinguished three main browser categories: Internet Explorer, Firefox and Other. These categories are represented by the inner circle in the graph. Interesting numbers, but our users require further specification. That’s why we added another circle containing segments within browser categories. Of course, we also displayed the version numbers in table below the graph.

Browser Breakdown

For those of you who haven’t found the time to download (or upgrade to) our latest version yet:
Get Logaholic 4.0 here.
(If you’re upgrading a self hosted edition from Logaholic 3.x, this manual item is very helpful.)

If you have any questions, please don’t hesitate to contact us at:
support@logaholic.com or by phone: +31 20 337 3075

Kind regards,
The Logaholic team

author admin, July 10, 2013

In 2005 Google bought web analytics solution Urchin and used it as the base for Google Analytics. Since then Google turned Google-Analytics into it’s flag product and Urchin development got less attention. In March 2012 Google announced the closing of Urchin.

Since then, Urchin users have been looking for other solutions. Why not use Google Analytics?
Because there are some important differences between these two tools apart from the fact that Google Analytics and Urchin aren’t compatible.

Data collection
Google Analytics uses ‘Page Tagging’ and works with a JavaScript tracker that is added to the user’s pages. Urchin could also parse web server log files, which allows for reporting of some additional metrics, such as: site errors and search engine crawler activity. (read this article on the differences of these methods).

Data storage
The Google Analytics tracker sends data directly to a centralized server. While Urchin kept Data local on the server.

Especially hosting / service providers using Urchin to host their clients statistics, Google Analytics falls short because:
– GA and Urchin are not compatible, history data is lost.
– There is no reliable method to automatically insert the JS tag in the web page source.
– Data privacy is more and more a hot topic.

Logaholic the perfect Urchin replacement; one of the few web analytics packages that processes log files, supports a JS Tag and can be installed locally.

Stop searching for the Urchin alternative you have found it. Logaholic does it all and more:
Highly scalable, seamlessly integrates in any size organizatioin or network.
Fast, reliable, feature rich, has an intuitive UI, offering a level of sophistication far beyond the capabilities of traditional log analyzers like AWStats, Analog Webalizer, including Urchin.

By reading this article on Page tagging vs log file analysis, you’ll learn that either method has its merrits. Logaholic supports both methods and can run in “Hybrid” mode complimenting web server log file data with JS Tag specific visitor data, resulting in even more accurate analytics.

Recently Logaholic has welcomed many ex- Urchin users and hosters, confirmation of a sitll high and growing demand for Log-Analyzers. We will continue improving our product enabling a more accurate focus on improving your business without the need for setup woes or other technical requirements.

Regards,
The Logaholic team

author admin, July 2, 2013

Logaholic Web Analytics announces the official release of Logaholic version 4.1

July 2, 2013
Amsterdam, The Netherlands

Logaholic announced today the official release of Logaholic version 4.1.
Included in this brand new version of the web analytics software are all kinds of speed optimizations, new features and other improvements.

One of the key features in Logaholic 4 is the ‘Datamanager’, which helps to keep the database small and fast.
Reports now load much faster than before, especially for high volume sites.

“Logaholic 4.1 offers lightning fast web analytics with tons of new features,” says Michael Erkelens, CEO

Another new feature is Logaholic’s ability to create Infographics.
These are graphical representations of data centered around topics and can be scheduled for weekly emails.
 
And there is more. With the new ‘Inpage Analytics’ statistics can be visualized in order to determine visitor behaviour.
Data is literally displayed IN the user’s website. With inpage analytics people find answers to questions like:
‘Which links are being clicked on?’ or ‘Do visitors really find what they are supposed to find?’

For hosting providers, Logaholic has added a subscription manager. This allows hosting providers to offer Logaholic to end-users with various report packages.

“Logaholic 4.1 represents a huge leap forward in terms of speed, features and usability. For example, users asked if they could get a daily PDF of a dashboard via email. That’s in there now,” says Mark Spier, Technical Manager

A detailed list of the changes in Logaholic 4 can be found here:
http://www.logaholic.com/2013/05/official-release-logaholic-4-0/

The new version of Logaholic can be downloaded here:
http://www.logaholic.com/getlogaholic

Instructions on upgrading can be found here:
http://www.logaholic.com/manual/references/upgrade-logaholic-3-x-to-logaholic-4-x-shespe/

About Logaholic
Logaholic provides customers with an effective and reliable statistics solution. The Web Analytics software is used in various industries and has grown to include many useful features. Logaholic web analytics software is found to be a leading source of information in many organizations. Many rely on Logaholic for measuring the performance of Content, Traffic, Keywords and Marketing. An important part of the clientele is formed by hosting providers, educational institutions, and service/solution providers like web development and online marketing firms. Since 2011 Logaholic web analytics software is included in cPanel, the world’s leading web hosting control panel solution.

Download this Press Release in PDF format

author admin, June 12, 2013

We now know that governments monitor your surfing history, social media activity, emails, etc. But, why should the NSA have all the fun? With Logaholic you can do detailed log file forensics on your own website logs.

Click Trails
Using reports like Click Trails you can drill down to the individual user level and investigate every step a user made on your site. It allows you to view the entire history of a selected visitor as he navigates through your website.
Learn more

Click Trails is a Premium report and is available in the Logaholic Report Store. Only this week, we would like to offer you a 25% discount! Use the following coupon-code during checkout: click24

Logaholic Click Trails Report

As a trained detective you might also want to monitor a Youtube channel. Logaholic can help you with that. Analyze a Facebook account? Check. Follow a Twitter profile? Check.

OSSEC
In addition, we are working on building analytics reports for OSSEC. OSSEC is an open source Intrusion Detection System that performs log analysis, file integrity checking, policy monitoring, rootkit detection, real-time alerting and active response. We are integrating OSSEC with Logaholic, so users can load all kinds of IDS reports in their dashboards.

Logaholic Click Trails Report
sneakpreview screenshot

We are very excited about it and would like to ask you to give us your input. Do you use OSSEC already, and if so, what information is most valuable to you? Or do you use another solution? Please let us know.

As a user of the Logaholic Self hosted edition, you already know that your stats are only stored on your own server. And that YOU are the only who can acces them. We take privacy very seriously.

For those of you who haven’t found the time to download (or upgrade to) our latest version yet:
Get Logaholic 4.0 here.
(If you’re upgrading a self hosted edition from Logaholic 3.x, this manual item is very helpful.)

If you have any questions, please don’t hesitate to contact us at:
support@logaholic.com or by phone: +31 20 337 3075

Kind regards,
The Logaholic team

author admin, June 5, 2013

Last week Logaholic 4.0 Beta was launched and it’s already a great succes. We got some very positive responses and valuable feedback. Thank you for that!
For those of you who haven’t found the time to download or upgrade yet: Get Logaholic here.
If you’re upgrading a self hosted edition from Logaholic 3.x, this manual item is very helpful.

In this blogpost we’re introducing one of the great new features of Logaholic 4.0: Infographics.
These are graphical representations of your data centered around topics, so you can have all important statistics at your fingertips. It’s data displayed in its simplest form and therefore very easy to digest. Looking at an infographic, you should know immediately where you stand.

The screenshot below gives you an idea of how your data will be visualized in a Logaholic Visitor infographic.

Infographic Screenshot

In Logaholic 4.0, three default infographics are available, based around the following themes: Visitor, Content and Traffic. You can configure Logaholic to send them automatically to your email account, showing your recent stats without having to log into Logaholic. This way you will be kept up-to-date on a regular basis and you’ll closely monitor any developments on your site. Automated infographic emails are sent three times a week, each of them containing a different topic.

Setting up Infographic emails
Step 1. Make sure your current version of Logaholic is 4.x
Step 2. Open “Edit Profile” in the software and choose the “Automation” tab. Click “Manage Email Alerts”
Step 3. Under “Create a new email alert” fill in your email address and check the box “Send Infographics”
Step 4. Save the new email alert and you’re done! Infographics containing your data will now be send three times a week.