 admin, May 1, 2018
Last week we introduced Logaholic 7.1, which adds a feature than can automatically analyze Web Analytics trends. We call it the News report. Since we’re pretty excited about this feature, let’s go ahead and take a closer look.

What’s the problem?
The problem with checking your Web Analytics regularly is that it often takes a lot of time because there is so much information.
Rather than just looking at a bunch of numbers on a screen you want to try to find meaning in the data. Why are my visitor numbers going up or down? Is my traffic from Google converting into customers? Where did that sudden spike in pageviews come from?
To answer these questions we need to closely look at multiple reports, charts and graphs, which can be time consuming.
The premise of the News report is that it will analyze the trends in your data for you, so you don’t have to spend any time on that.
The News report will show you a text digest, highlighting any noteworthy events in your data. To do this the News report looks at a number of Web Analytics trends. These are:
- Visitors and pageviews
- Country trends
- Page trends
- Referrer trends
- Error trends
- Conversion trends
- Keyword trends
- Bot/Crawler trends
The report identifies any significant events by calculating the standard score (also called Z-Score). For weekdays, the average used to evaluate an observation are based on all weekdays within the selected date range. Saturdays and Sundays use separate averages for each day.
In statistics, the standard score is the signed number of standard deviations by which the value of an observation or data point is above the mean value of what is being observed or measured.
https://en.wikipedia.org/wiki/Standard_score

The report will allow you to choose a default z-score, which will determine how sensitive it is to changes in your data. This will result in an increase or decrease the number of news items you see in the report.
Let’s take a look at an example below:
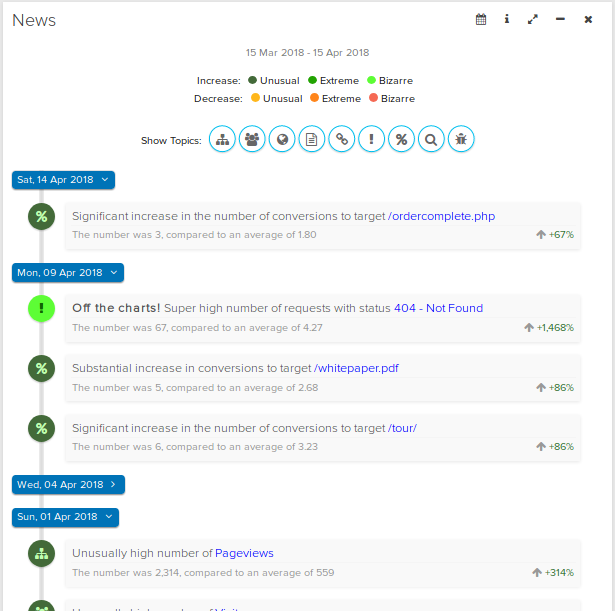
Notice the news items are categorized by topic, and color coded to reflect the rise or decrease observed.
The topic of any news item can be clicked to pull up a context menu which will allow you to investigate the issue further. The menu will give you quick access to different reports in the software like trends, conversion rates or anything else that is relevant to the context of the news item.
This makes the News report the ideal starting point for investigating your traffic. It will give you an instant overview of the most important events that occurred in your data since the last time you looked and provide you with a targeted entry point for deeper analysis.
The News report is available in Logaholic 7.1 and were happy to announce that it’s in the free version so everyone can use it out of the box.